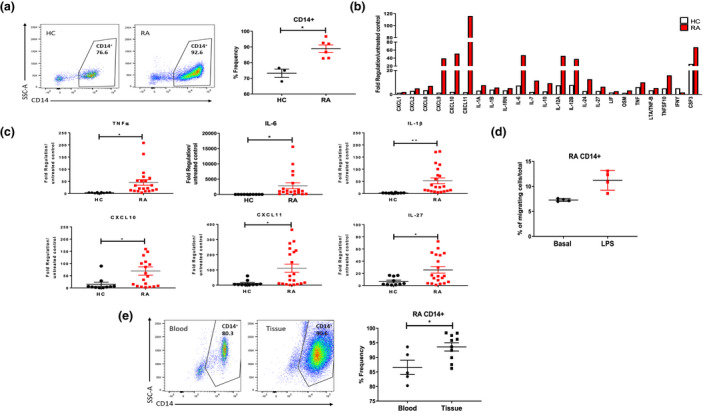
Figure 1.

(a) Difference in expression of CD14+ cells in PBMC from HC and RA patients. Left, representative flow cytometry plots. Right, percentage frequency of CD14+ cells in healthy (n = 3) and RA (n = 6) blood. (b) Gene expression of RA vs HC monocytes stimulated with LPS with more than 1.5‐fold difference (n = 3). Data are expressed as upregulation compared to unstimulated control and normalised to housekeepers β‐actin, B2M, GAPDH, HPRT1 and RPLPO. (c) Gene expression between healthy (n = 14 or 15) and RA (n = 19 or 21) monocytes, represented as fold change in response to LPS stimulation. (d) CD14+ RA monocyte migrating cells in response to LPS stimulation (n = 4). (e) Percentage frequency of CD14+ cells in RA blood (n = 5) and RA synovial tissue (n = 10). Data are represented as mean ± SEM; Mann–Whitney U‐tests and t‐tests were used as appropriate. *P < 0.05, **P < 0.01.
