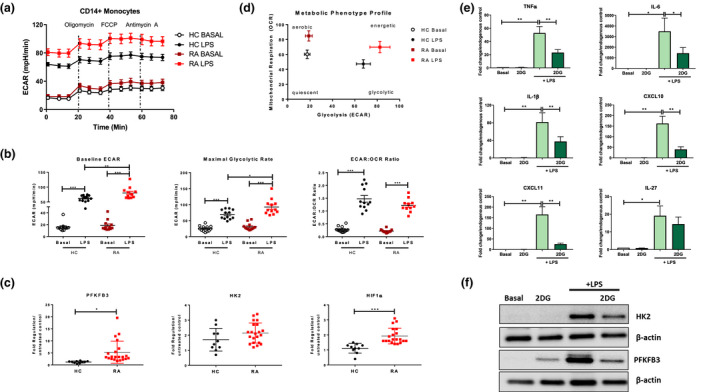
Figure 3.

(a) Seahorse bioenergetics profile (average) demonstrating ECAR of HC (n = 12) and RA (n = 12) monocytes before and after injections of oligomycin, FCCP and antimycin A in ex vivo resting untreated and LPS‐stimulated (100 ng mL−1; 1 h) monocytes. (b) Baseline glycolysis, maximal glycolytic rate and ECAR:OCR ratio, expressed as mean ± SEM. (c) Dot plots represent gene expression of PFKFB3, HK2, HIF1α in HC (n = 10) and RA (n = 21) monocytes. Data are represented as fold change in response to LPS stimulation, mean ± SEM. RA CD14+ monocytes (n = 7) were stimulated with LPS (100 ng mL−1) for 3 h ± 2DG. (d) Overall metabolic profile of untreated and LPS‐stimulated HC (n = 12) and RA (n = 12) monocytes. (e) RA monocytes (n = 7) were stimulated with LPS (100 ng mL−1) for 3 h ± 2DG. Gene expression of RA monocytes TNFα, IL‐6, IL‐1β, CXCL10, CXCL11 and IL‐27, mean ± SEM. (f) Representative Western blots showing PFKFB3 and HK2 protein expression in CD14+ RA monocytes. The Wilcoxon signed rank test, a Mann–Whitney U‐test or a paired t‐test were used as appropriate. *P < 0.05, **P < 0.01, ***P < 0.005.
