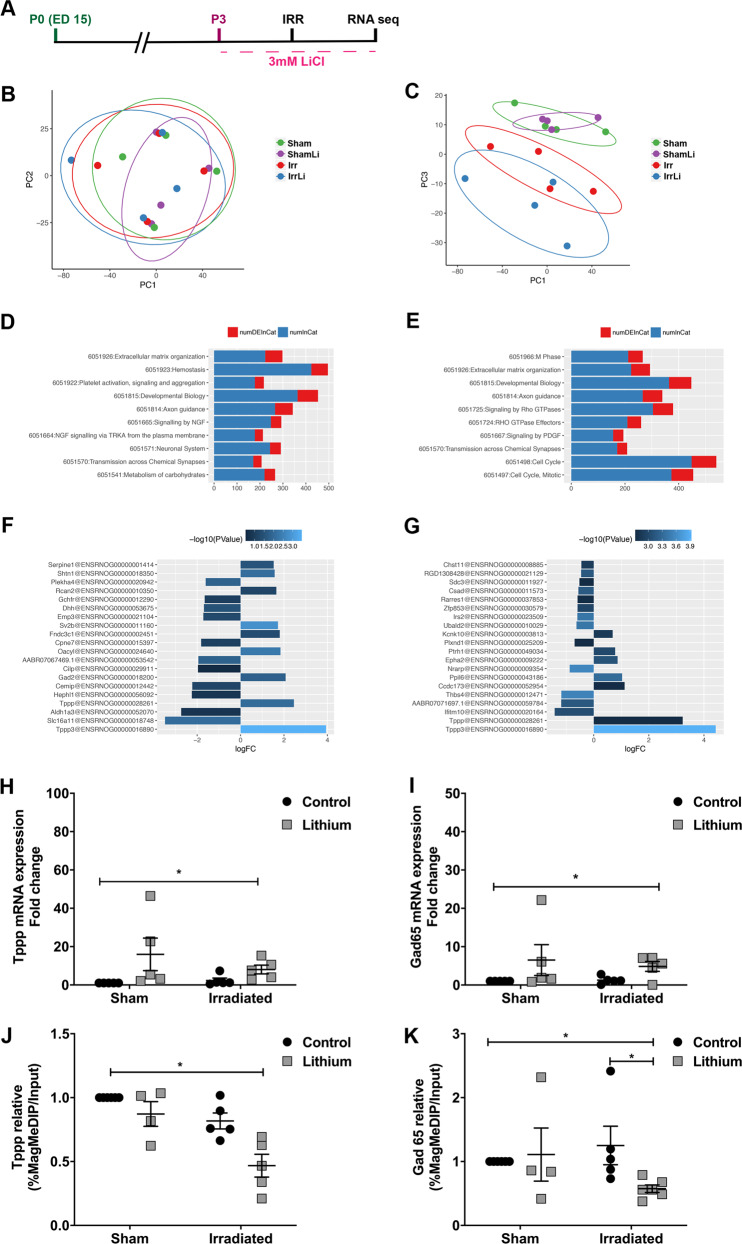
Fig. 3.
Lithium regulated the expression of genes involved in cell cycle and neuronal transmission in vitro. a Timeline of the in vitro experimental design showing that neural stem progenitor cells (NSPC) were established at passage 0 (P0) and at passage 3 (P3) they were exposed to lithium and irradiation followed by RNA sequencing. b, c Principal component (PC) analysis plots based on the filtered and normalized counts per million that allowed us to identify the uncorrelated variables to explain the source of maximum amount of variance in the different treatment groups (Sham, ShamLi, Irr, and IrrLi). d Gene ontology (GO) analysis revealed that the changes in the reactome of different treatment groups for PC2 were related to neuronal transmission. ‘numDEInCat’ is the number of differentially expressed (DE) genes in the corresponding GO category, whereas ‘numInCat’ is the number of detected genes in the corresponding GO category. e Gene ontology (GO) analysis revealed that the changes in the reactome of different treatment groups for PC3 were related to cell cycle regulation. f Table of differentially expressed genes in Sham cells compared with ShamLi cells treated with lithium. g Table of differentially expressed genes in irradiated cells compared with irradiated cells. h Gene expression analysis of the identified cell cycle gene shows that lithium significantly increased Tppp expression in both sham and irradiated cells. Two-way ANOVA shows the effect of lithium treatment: irradiation (F1,16 = 0.5473, p = 0.4702), LiCl (F1,16 = 5.439, *p = 0.0331). i Gene expression analysis of the identified neuronal transmission gene shows that lithium significantly increased GAD65 expression in both Sham and Irr cells. Two-way ANOVA shows the effect of lithium treatment: irradiation (F1,16 = 0.1073, p = 0.7475), LiCl (F1,16 = 4.576, *p = 0.0482). Error bars represent SEM. ****p < 0.0001; **p < 0.01; *p < 0.05. j Methylation analysis by MeDIP-qPCR of Tppp showing a significant difference between groups (*p = 0.0145). Post hoc test showing a significant decrease in the IrrLi group compared with the Sham group (*p = 0.0123). k MeDIP-qPCR analysis of Gad65 showing a significant difference between groups (*p = 0.0112). Post hoc test showing a significant decrease in the IrrLi group compared with the Sham (*p = 0.0284) and IrrLi groups (*p = 0.0273)

