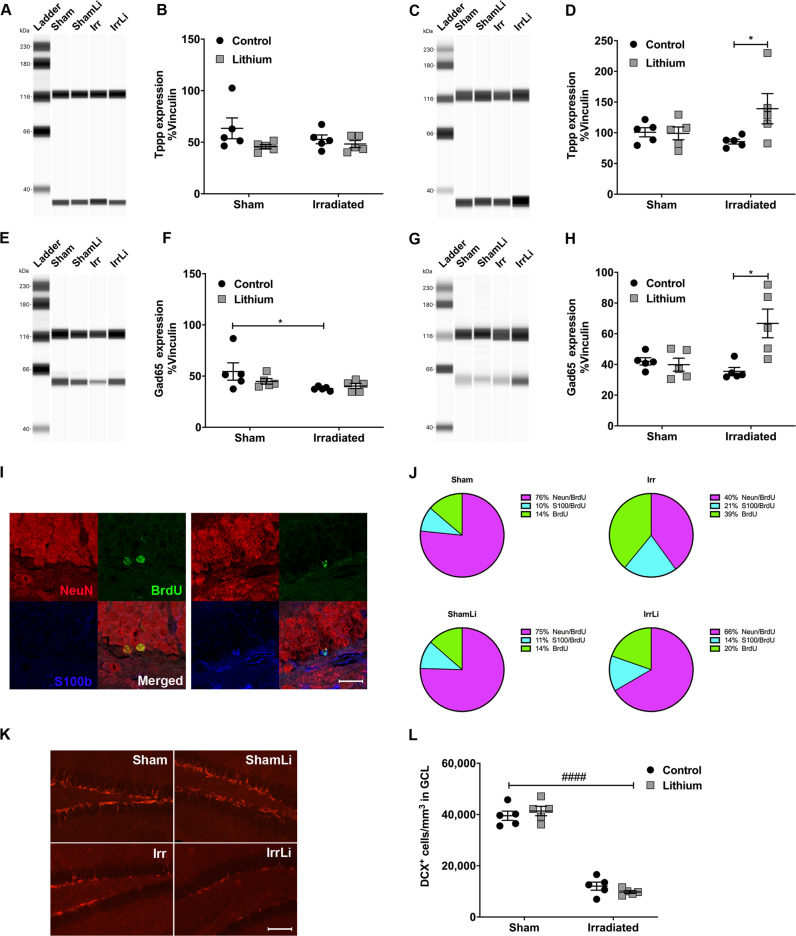
Fig. 4.
Lithium regulated the expression of cell cycle and neuronal transmission proteins in vivo and reverted the irradiation-induced changes in NSPC fate progression in the mouse DG. a Representative western blot lanes of Tppp migration at PND 77. Tppp signal was observed at the MW of 37 kDa. Vinculin, used as a loading control, was observed at the expected MW of 118 kDa. b Dot plot graph showing the quantification of the normalized chemiluminescence peak of Tppp against its loading control vinculin at PND 77. Tppp expression levels in the DG were unaltered in all treatment groups. Two-way ANOVA: irradiation (F1,16 = 0.4998, p = 0.4898), lithium (F1,16 = 3.654, p = 0.0740). c Representative western blot lanes of Tppp migration at PND 91. d Dot plot graph showing the quantification of the normalized chemiluminescence peak of Tppp against its loading control vinculin at PND 91. The Tppp expression level in the DG was significantly increased in the IrrLi group (*p = 0.0313). Two-way ANOVA: irradiation (F1,16 = 0.7927, p = 0.3865), lithium (F1,16 = 3.414, p = 0.0832). e Representative western blot lanes of GAD65 migration at PND 77. GAD65 signal was observed at the MW of 65 kDa. Vinculin, used as a loading control, was observed at the expected MW of 118 kDa. f Dot plot graph showing the quantification of the normalized chemiluminescence peak of GAD65 against its loading control, vinculin at PND 77. GAD65 expression level in the DG was significantly reduced in the Irr group (*p = 0.0431) but no change was observed in the other groups. Two-way ANOVA: irradiation (F1,16 = 5.232, *p = 0.0361), lithium (F1,16 = 0.599, p = 0.4502). g Representative western blot lanes of GAD65 migration at PND 91. h Dot plot graph showing the quantification of the normalized chemiluminescence peak of GAD65 against its loading control vinculin at PND 91. GAD65 expression level in the DG was significantly increased in the IrrLi group (**p = 0.0017). Two-way ANOVA: irradiation (F1,16 = 3.543, p = 0.0781), lithium (F1,16 = 7.228, *p = 0.0161. i Representative confocal images of NeuN (red), BrdU (green), and S100β (blue) immunoreactivity in the GCL at PND 105 depicting colocalization of BrdU and NeuN in mature neurons (upper panel) and colocalization of BrdU and S100β in an astrocyte (lower panel). Scale bar = 20 µm. ×63 magnification. j Pie chart of the percentages of BrdU cells double labeled for NeuN or S100β. The percentages of NeuN+/BrdU+ cells were significantly increased in the IrrLi (**p = 0.0031) but not in ShamLi (p > 0.9999) group. Two-way ANOVA: irradiation (F1,14 = 22.5, ***p = 0.0003), lithium (F1,14 = 7.02, *p = 0.0191). The percentages of S100β+/BrdU+ were significantly increased after irradiation but partly normalized by lithium treatment. Two-way ANOVA: irradiation (F1,14 = 4.89, *p = 0.0442), lithium (F1,14 = 0.831, p = 0.3774). The remaining percentages of BrdU+ cells were significantly increased in the Irr group (*p = 0.0137) but not altered in the other groups. Two-way ANOVA: irradiation (F1,14 = 13.1, **p = 0.0028), lithium (F1,14 = 5.12, *p = 0.0401). k DCX immunoreactivity in the GCL at PND 105 in different treatment groups. Scale bar = 100 µm. ×20 magnification. l Interleaved dot plot graph of the quantification of DCX+ cells in the GCL showing the effect of irradiation (****p < 0.0001) on the density of DCX-positive cells in the GCL. Two-way ANOVA: irradiation (F1,16 = 372.2, ####p < 0.0001), lithium (F1,16 = 0.02213, p = 0.8836). Error bars indicate SEM. ***p < 0.001; **p < 0.01; *p < 0.05

