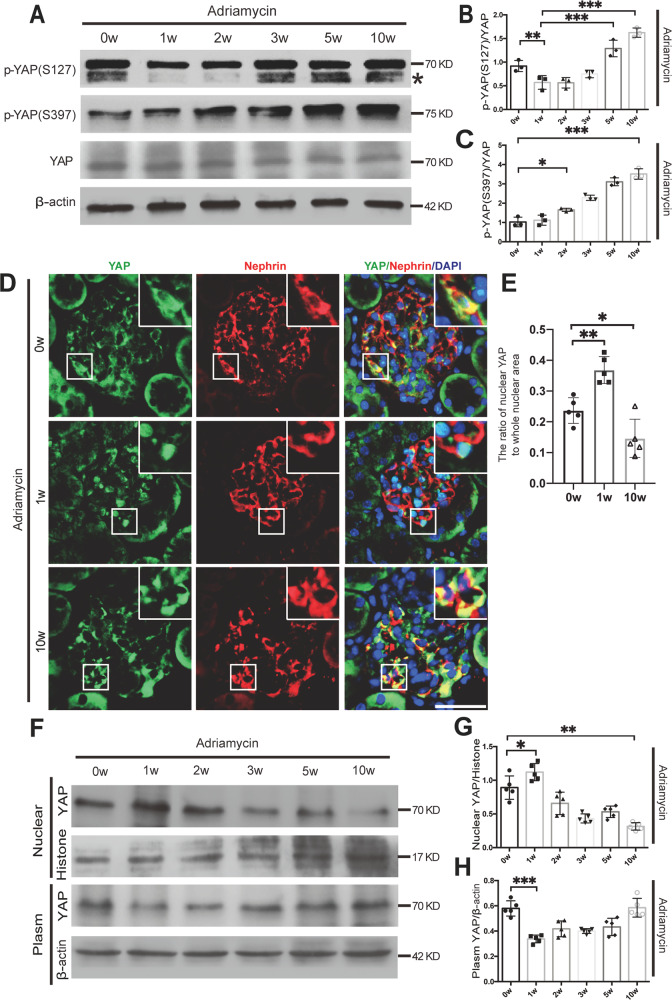
Fig. 3. The phosphorylation and distribution of YAP in the Adriamycin-induced FSGS mouse model.
A–C Immunoblotting showed p-YAP (S127) was increased by 5w and p-YAP (S397) was increased by 2 weeks of Adriamycin treatment. D Double immunofluorescence staining with YAP and Nephrin revealed relatively uniform distribution of YAP in podocytes nuclear and cytoplasm at 0w, an obvious nuclear aggregation at 1 week and translocating to cytoplasm at 10w in mice with Adriamycin treatment. Shown are representative images from at least five mice with similar results. Images of higher magnification are shown in the right upper corner. E Quantification of YAP positive nuclear area in podocytes of each group as described in Fig. 1C. F–H Immunoblotting of nuclear or cytoplasm protein from glomeruli protein of mice. Shown are representative blots from at least three separate experiments with similar results. *Denotes a nonspecific band. *P < 0.05, **P < 0.01, ***P < 0.001 compared to 0 week or 1 week after Adriamycin treatment (Scale bar: 20 μm in D).

