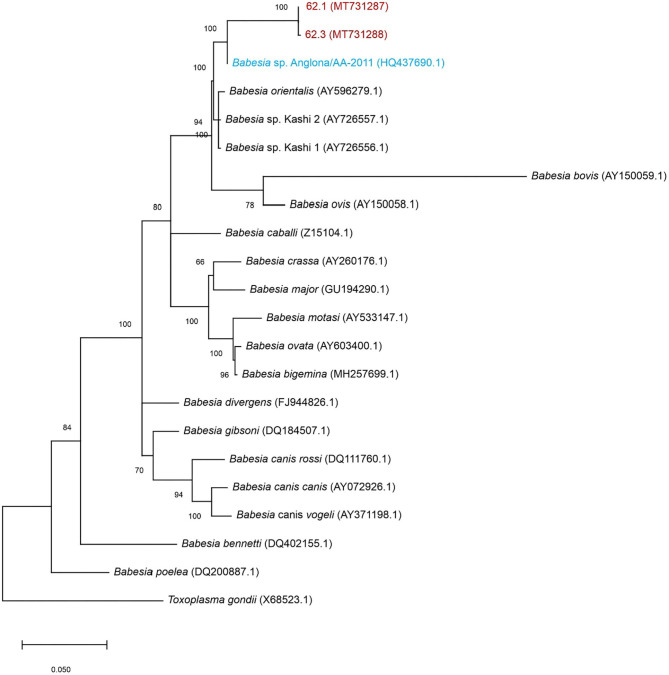
Figure 3.
Maximum-likelihood tree based on 18S rRNA nucleotide sequences. The tree shows the phylogenetic relationship between the porcine isolates (MT731287 and MT731288-red), B. sp. Suis (HQ437690.1-blue) compared to other Babesia spp. Toxoplasma gondii was included as outgroup. The numbers at the internal nodes represent the percentage of 1,000 replicates (bootstrap) for which the same branching patterns were obtained. The percentage of trees in which the associated taxa clustered together is indicated next to the branches. The tree with the highest log likelihood (−3,933.11) is shown.

