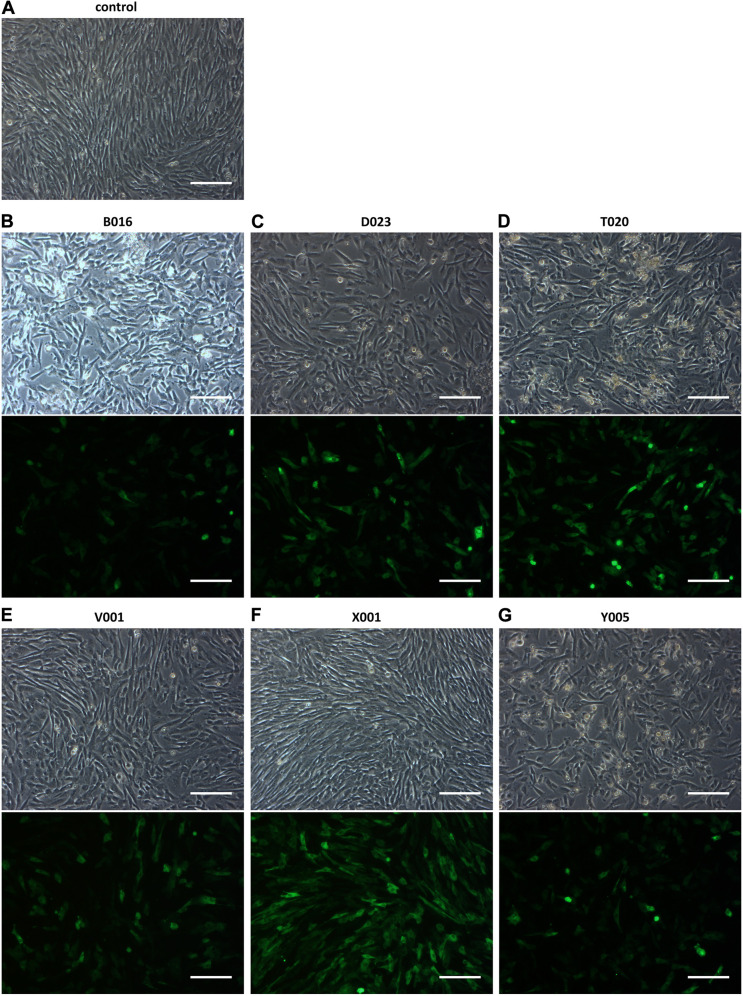
FIGURE 1.
Nucleofection optimization of CPCs with different programs. (A) Control figure shows nucleofected CPCs with no DNA. (B–G) GFP expression in CPCs as a result of different nucleofection programs. Upper rows show bright field images of nucleofected CPCs and lower rows show GFP expression. Images shown are representative examples of duplicate experiments. Scale bars represent 200 μM.

