FIGURE 5.
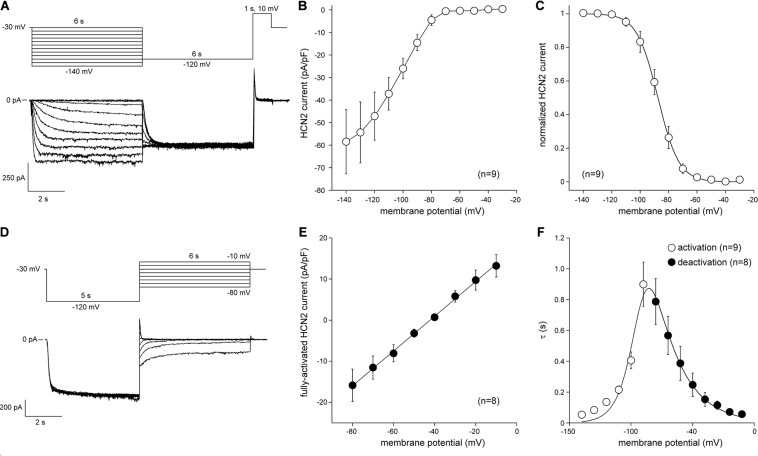
Hcn2 current measured at measured at 36°C in single LV-transduced CPCs. (A) Typical Hcn2 current traces (bottom panel) activated with a double pulse voltage clamp protocol (top panel) to determine current density and activation properties. (B) Average current-voltage (I–V) relationship of the Hcn2 current. (C) Voltage dependence of Hcn2 current activation. Solid line is the Boltzmann fit to the experimental data. (D) Typical Hcn2 current traces (bottom panel) activated with a double pulse voltage clamp protocol (top panel) to determine the reversal potentials and deactivation properties. (E) I–V relationship of the fully activated Hcn2 current. Solid line is the linear fit to the experimental data. (F) Time constants of (de)activation. Solid line is the best fit curve to the equation τ = 1/[A1 × exp(–V/B1) + A2 × exp(V/B2)], where τ is the activation or deactivation time constant (s), and A1, A2, B1, and B2 are calculated fitting parameters, which amount to 3.2164⋅10– 8s– 1, 9.2311 s– 1, 0.041248 mV, and 21.724 mV, respectively (Qu et al., 2004).

