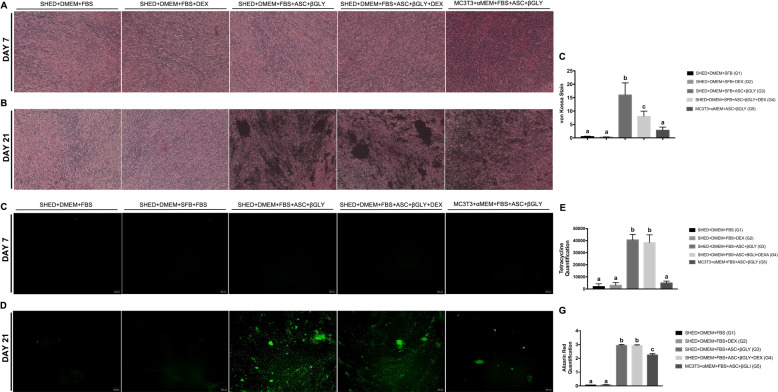
Fig. 4.
Extracellular matrix mineralization. A Von kossa staining on day 7 (n = 12 for each group) and B on day 21 (n = 12 for each group); C quantification of extracellular matrix mineralization by te Von kossa assay on day 21 using Image J software (NIH) (n = 12 for each group). Different lower-case letters refer to a significant difference (ANOVA/Tukey test, p < 0.05) among groups at the same experimental time; D tetracycline fluorescence on day 7 (n = 12 for each group) and E on day 21 (n = 12 for each group); F quantification of mineralization nodules by the tetracycline assay on day 21 (n = 12 for each group). Different lower-case letters refer to a significant difference (ANOVA/Tukey test, p < 0.05) among groups at the same experimental time; G red alizarin quantification on day 21 (n = 12 for each group). Different lower-case letters refer to a significant difference (ANOVA/Tukey test, p < 0.05) among groups at the same experimental time

