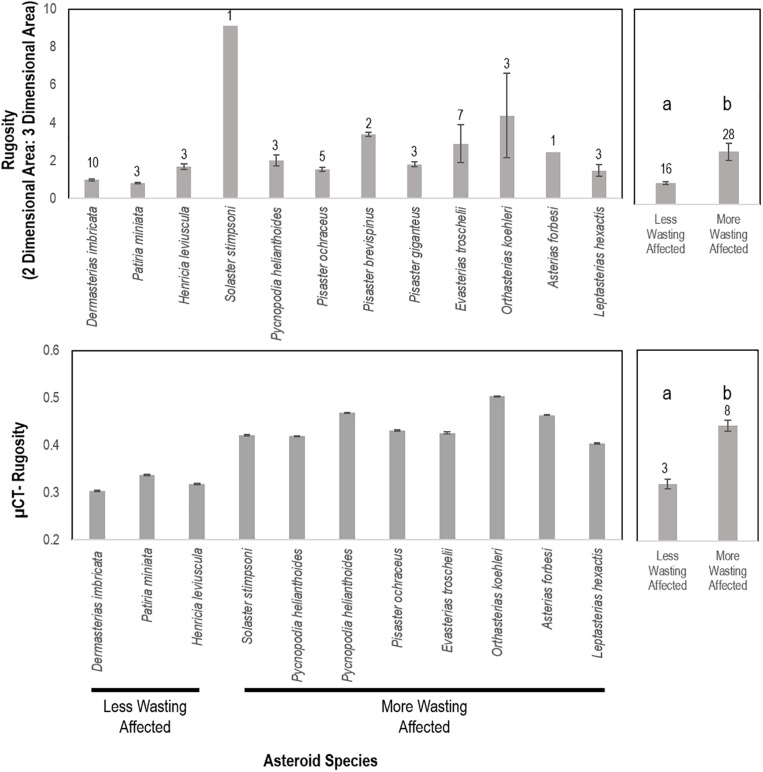
FIGURE 9.
Rugosity of similarly sized specimens between wasting-affected and less wasting affected species as determined by whole animal computed tomography (top) and of an asteroid ray by micro-computed tomography (bottom). a,b denote significant difference at p < 0.001. More and less wasting affected assignment were based upon previous work and defined in the text.

