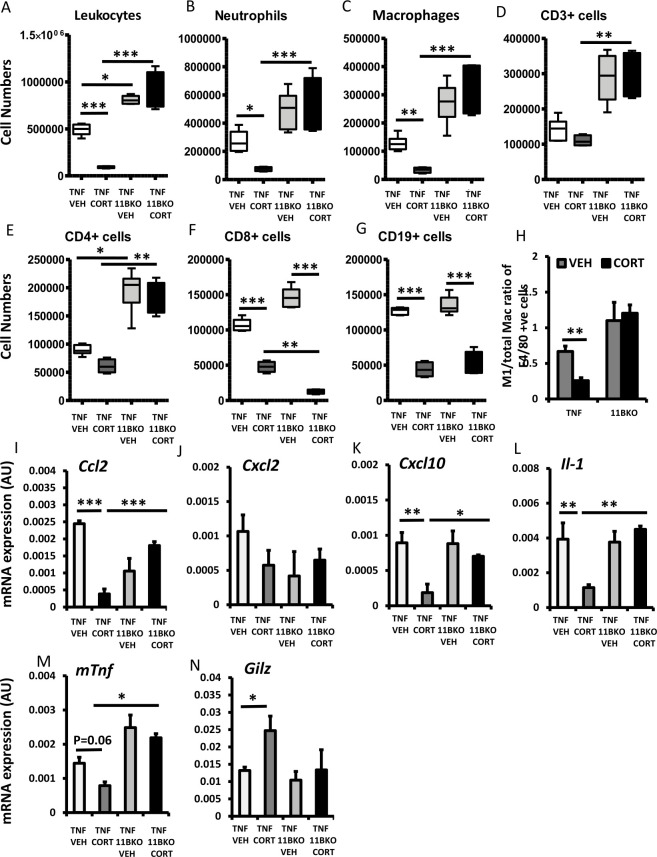
Figure 3.
Cell numbers of (A) total leucocytes, (B) neutrophils, (C) macrophages, (D) CD3+ populations, (E) CD4+ populations, (F) CD8+ populations, (G) CD19+ populations and (H) the M1-like/total macrophage ratio determined by flow cytometry in tumour necrosis factor (TNF)-tg and TNF-tg11βKO animals receiving vehicle or corticosterone (100 µg/mL) in the drinking water for 3 weeks. Gene expression (AU) of (I) Ccl2, (J) Cxcl2, (K) Cxcl10, (L) Il-1, (M) mTnf and (N) Gilz determined by quantitative PCR in tibia isolated from TNF-tg and TNF-tg11βKO animals receiving vehicle or corticosterone (100 µg/mL) in the drinking water for 3 weeks. Values are expressed as mean±SE, n=6 per group. Statistical significance was determined using two-way analysis of variance with Tukey post hoc analysis. *P<0.05, **p<0.005, ***p<0.001.

