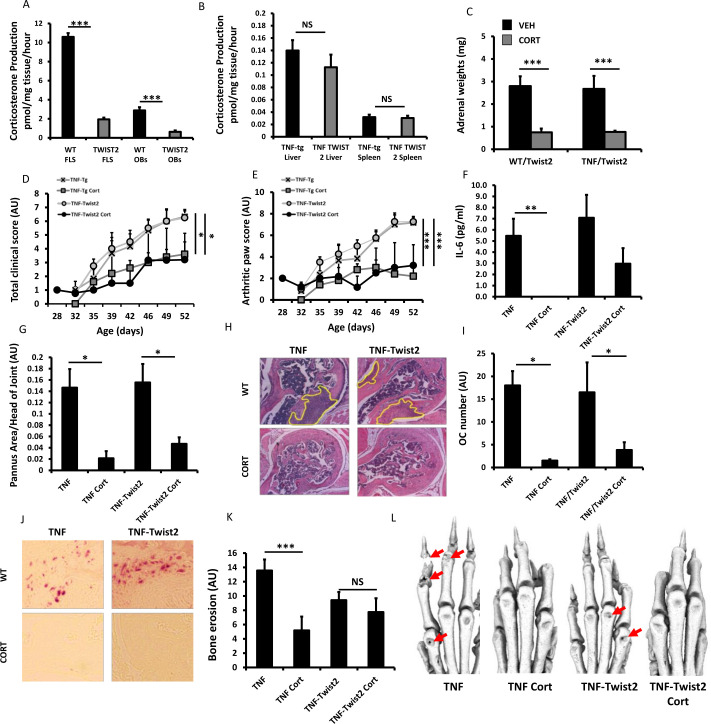
Figure 4.
Corticosterone production (pmol/mg tissue/hour) in (A) fibroblast-like synoviocytes (FLS) and osteoblasts (OBs) cultures and (B) liver and spleen ex vivo biopsies isolated from tumour necrosis factor (TNF)-tg and TNF-tg11βflx/tw2cre mice determined by scanning thin layer chromatography. (C) Adrenal weights (mg), (D) total clinical scores (AU), (E) arthritic paw scores (arbitrary units (AU)), (F) serum IL-6 determined by ELISA, (G) histological scoring (AU) and (H) representative images of synovitis at the ulna/humerus joint interface, (I) histological scoring (AU) and (J) representative images of TRAP stained osteoclast numbers at the ulna/humerus joint interface, (K) quantification of bone erosion (AU) in the wrist, metacarpals and phalanges and (L) representative images of three-dimensional reconstructions of front paws in TNF-tg and TNF-tg TNF-tg11βflx/tw2cre animals receiving either vehicle or corticosterone (100 µg/mL) in the drinking water for 3 weeks. Values are expressed as mean±SE, n=6 per group. Statistical significance was determined using two-way analysis of variance with Tukey post hoc analysis. *P<0.05, **p<0.005, ***p<0.001.

