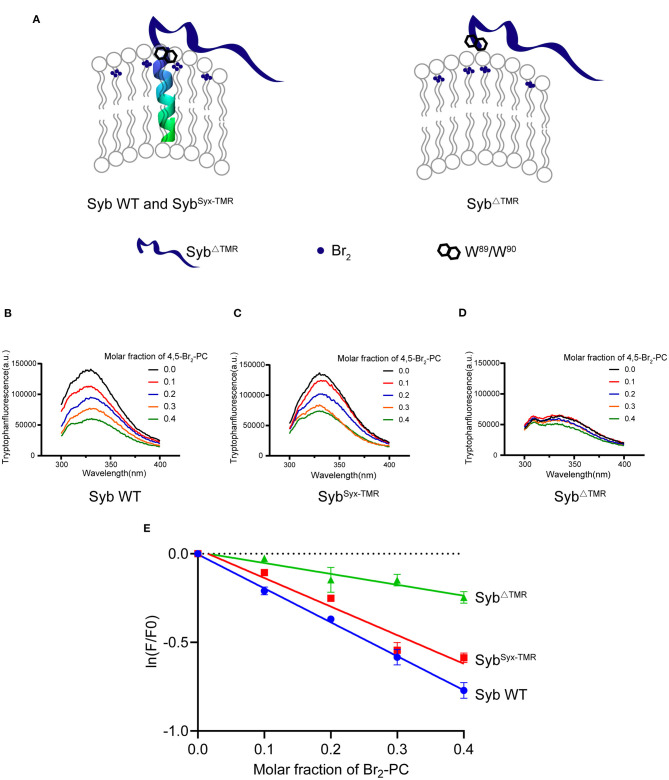
Figure 3.
W89/W90 of TMR anchored synaptobrevin-2 are resided at the membrane-water interface. (A) Schematic diagrams of lipid quenching assay showing that fluorescence of embedded tryptophans in TMR anchored synaptobrevin-2 were quenched by lipid quencher 4,5-Br2-PC. (B–D) Quenching of tryptophan fluorescence by different molar fraction of 4,5-Br2-PC in synaptobrevin-2 WT (B), SybSyx−TMR (C), and SybΔTMR (D) liposomes. The samples were excited at 285 nm, and the emission spectra were collected in the range of 300–400 nm. (E) Quantification of the fluorescent intensities in (B–D) of synaptobrevin-2 WT (solid blue circles), SybSyx−TMR (solid red squares), and SybΔTMR (solid green triangles) liposome. The total fluorescence intensity (F) was calculated by integrating the intensity in the emission spectral range. (F0) represents the fluorescent intensity in the absence of 4,5-Br2-PC, ln (F/F0) is plotted against the 4,5-Br2-PC molar fraction. Linear regression was performed by Prism 6.01. Bars in (E) are presented as Means ± SDs, n = 3.

