FIGURE 7.
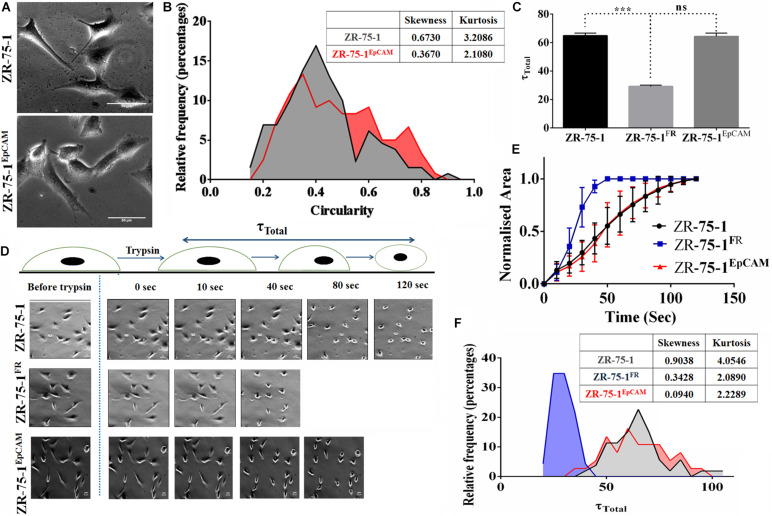
Measurement of cellular morphology and contractility parameters. (A) Photomicrograph showing the morphology of ZR-75-1 and ZR-75-1EpCAM cells (scale bar 20 μm). (B) Graphs showing the relative frequency distribution of ZR-75-1 and ZR-75-1EpCAM cells based on their circularity. Inset table represents skewness and kurtosis determined from the histogram data. (C) Graph representing the total de-adhesion time constant (τTotal) of ZR-75-1, ZR-75-1FR, and ZR-75-1EpCAM cells. (D) Time lapse photomicrograph of de-adhesion kinetics of ZR-75-1, ZR-75-1FR, and ZR-75-1EpCAM cells (scale bar 20 μm). (E) Graph showing the normalized area of ZR-75-1, ZR-75-1FR, and ZR-75-1EpCAM cells during the de-adhesion kinetics as a function of time. (F) Graph showing the relative frequency distribution of ZR-75-1, ZR-75-1FR, and ZR-75-1EpCAM cells based on their τTotal values. Inset table represents skewness and kurtosis determined from the histogram data. The statistical significance of (C) is determined by the Student’s t-test. ns, non-signficant, ***P < 0.001.

