FIGURE 8.

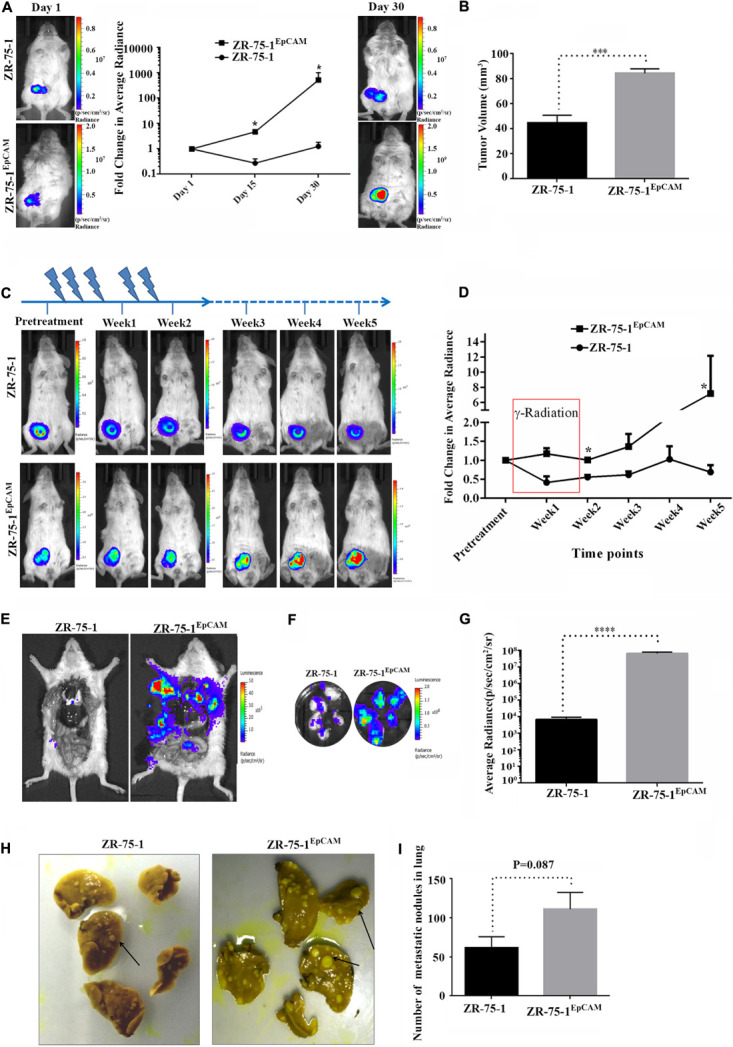
Effect of EpCAM overexpression on in vivo tumor growth, RT efficacy and distant metastasis. (A) Representative bioluminescence images of mice (n = 5) imaged at different time intervals after ZR-75-1 and ZR-75-1EpCAM cell implantation in the mammary fat pad. The graph represents fold change in bioluminescence signal with respect to the signal on day 1. (B) Chart showing difference in measured tumor volume on day 30. (C) Bioluminescence images showing in vivo growth kinetics of ZR-75-1 and ZR-75-1EpCAM tumors undergoing RT treatment for 2 weeks, as indicated. (D) Graph representing fold change in tumor bioluminescence signal with respect to the tumor before treatment. (E) Representative images of the ventral view of the mouse from each group dissected and scanned for luciferase signal to show the extent of distant metastasis in major organs. (F,G) Bioluminescence images of dissected lung lobes of control and EpCAM overexpressing group and chart showing quantitative photon signal measured from lungs. (H,I) Representative photographs of fixed lung tissue with metastatic nodules present at the lung surface (black arrow) and a chart showing numbers of surface nodules counted from these. *P < 0.05, ***P < 0.001, and ****P < 0.0001.
