FIGURE 2.
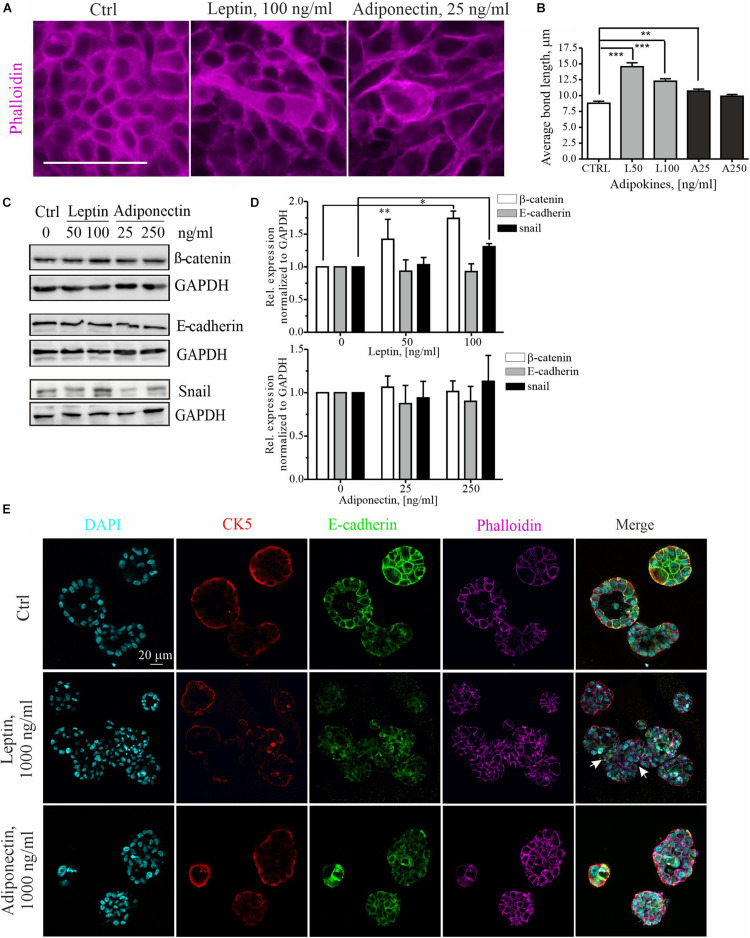
Leptin treatment disrupts the epithelium and induces EMT markers. (A) Ctrl, leptin- and adiponectin-treated MCF10A cell monolayers after 72 h in culture. Treatment with 100 ng/ml of leptin disrupted epithelial sheet morphology and led to elongation of the cells within the monolayer. Actin cytoskeleton was visualized with phalloidin. Scale bar 50 μm. (B) Monolayer morphology was evaluated from the phalloidin stainings by using the Tissue analyzer plugin for Image J. Average length of the cell-cell bonds after leptin and adiponectin treatments was assessed. **p < 0.01, ***p < 0.001, One-way ANOVA, Tukey’s post-test. (C) Cellular lysates of ctrl, leptin- and adiponectin-treated cells were analyzed by Western blotting. Specific antibodies against β-catenin, E-cadherin and snail were utilized. GAPDH acts as a loading control. (D) Western blot quantification related to Figure 2C. n = 3 (for snail) and n = 4 (for E-cadherin and β-catenin), Student’s t-test, *p < 0.05, **p < 0.01). (E) MCF10A cells were culture in 3D matrigel for 14 days, after which they were fixed and used for immunofluorescence stainings. Specific antibodies against CK5 and E-cadherin were utilized. Phalloidin was used to detect actin cytoskeleton and DAPI nuclei. CK5 stains the outer, myoepithelial cell layer. Images show the morphology of 3D spheroids from MCF 10A cells treated with leptin or adiponectin (1,000 ng/ml for both). Leptin was changing the spheroid structure to irregular (indicated with white arrows). Scale bar 20 μm.

