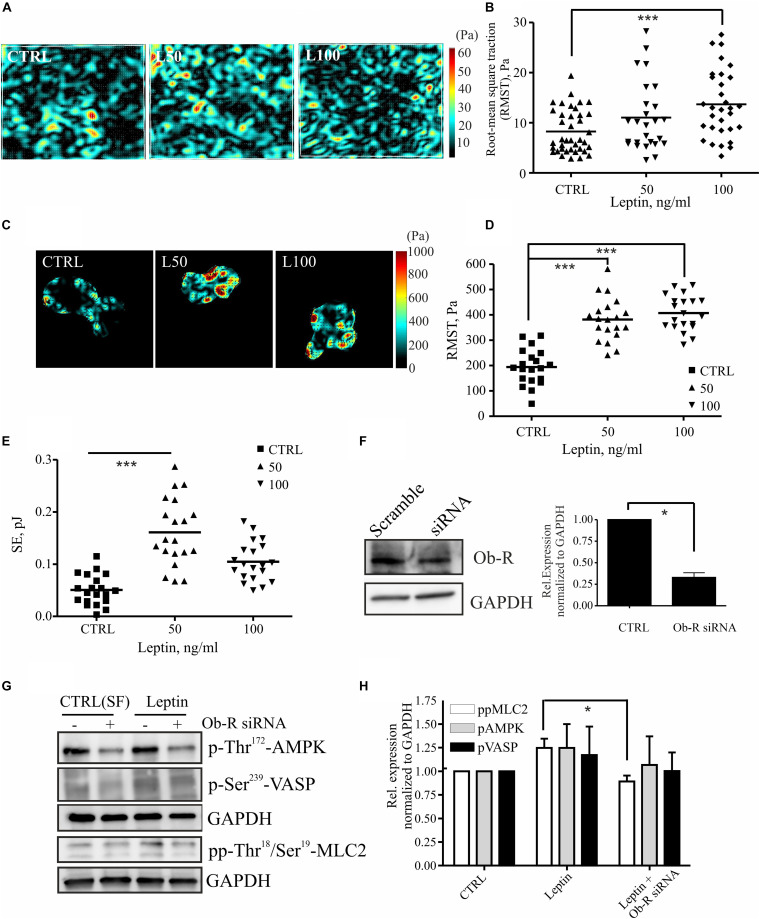
FIGURE 4.
Leptin increases cell-substrate forces potentially through MLC-2 phosphorylation. (A,B) monolayer force measurements on silicone gels with 1 kPa stiffness after 72 h leptin treatment of monolayer MCF 10A cells. For (B) all values and the median are presented within each group, n = 26–39, ***p < 0.001, One-way ANOVA, Tukey’s post-test. (C,D) Traction forces exerted by cell doublets. Representative maps are shown in (C) and calculations of cell-exerted forces RMST in (D) and strain energy (SE) to the substrate in (E). For (D,E) all values and the median are presented within each group, n = 19–20, ***p < 0.001, One-way ANOVA, Tukey post-test. (F) Efficiency of OB-R siRNA, mean values ± SEM, n = 4; Student’s t-test, *p < 0.05. (G) Cellular lysates of MCF10A cells, –/+ Ob-R siRNA and leptin (100 ng/ml) were utilized in Western blot experiments. Specific antibodies against pp-Thr18/Ser19 MLC-2, Thr172 AMPK and p-Ser239 VASP were used. GAPDH acts as a loading control. (H) Quantifications of the Western blot for pAMPK, pVASP, and pp-MLC-2, related to (G); mean values ± SEM, n = 3; *p < 0.05, Student’s t-test, N.S.

