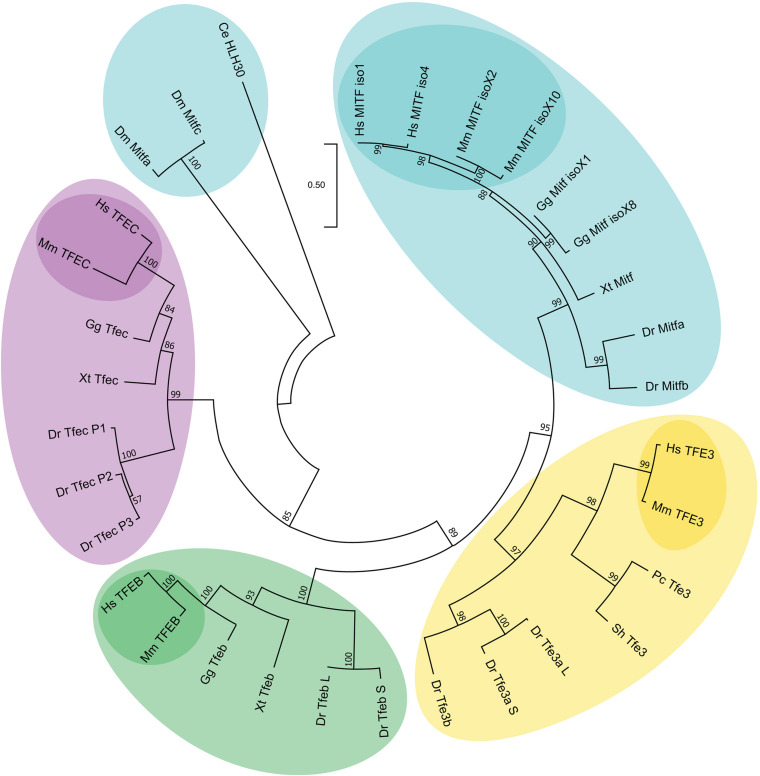
FIGURE 1.
Phylogenetic relationships of the different MiT/TFE family members. Evolutionary comparison of different members of the MiT/TFE protein family represented in a phylogenetic rooted tree generated using MEGA X program (ver. 10.1.8) with a Maximum Likelihood and JTT matrix-based model and 1,000 bootstrap replicates (Jones et al., 1992; Kumar et al., 2018). The tree with the highest log likelihood (–17751.05) is shown. The percentage of trees in which the associated taxa clustered together is shown next to each branch. The tree is drawn to scale, with branch lengths measured in the number of substitutions per site. The scale of the branch lengths is indicated below the tree. The four MiT/TFE members are highlighted in different colors. Mammalian proteins are highlighted in darker colors. Ce, Caenorhabditis elegans; Dm, Drosophila melanogaster; Dr, Danio rerio; Gg, Gallus gallus; Hs, Homo sapiens; L, long; Mm, Mus musculus; P1-3, protein 1–3; Pc, Phasianus colchicus; S, short; Sh, Strigops habroptila; Xt, Xenopus tropicalis.

