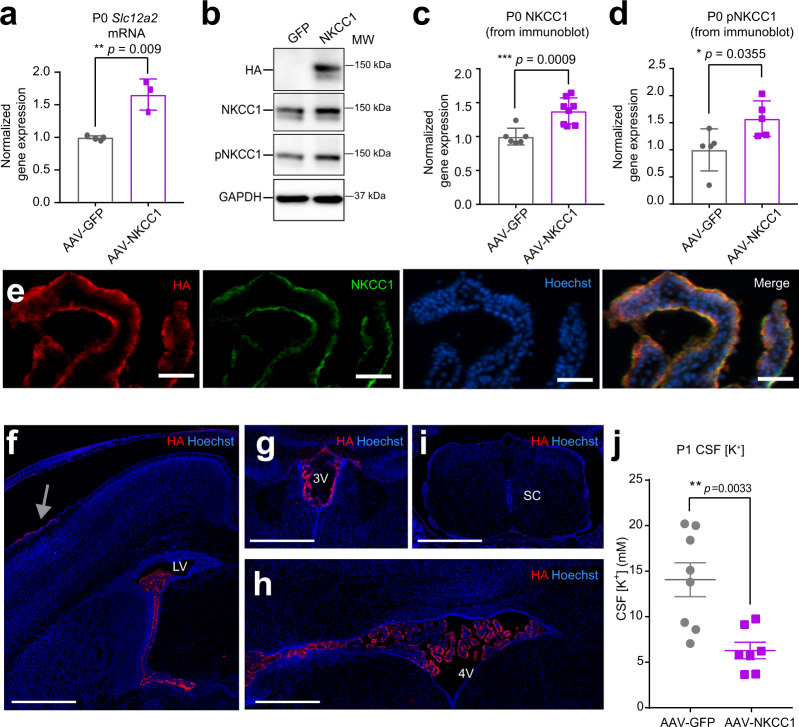
Fig. 4. ChP NKCC1 actively mediates CSF K+ clearance during the first postnatal week.
a RT-qPCR of NKCC1 mRNA levels in P0 mice. Gray: AAV-GFP; purple: AAV-NKCC1 (same color scheme is used for the rest of this figure). **p = 0.009, N = 3; Welch’s two-tailed unpaired t-test. b Immunoblots from AAV-NKCC1 vs. AAV-GFP P0 mice ChP lysates, representative of three independent experiments, each contained multiple biological replicates (the exact numbers and raw blots are included in the Source Data with quantification presented in panels c and d). c, d Quantification of all immunoblots of NKCC1 c ***p = 0.0009, N = 7; Welch’s two-tailed unpaired t-test; and pNKCC1 d *p = 0.0355, N = 5; Welch’s two-tailed unpaired t-test. All samples for direct quantitative comparison were on the same blot (see Source Data). e Immunofluorescence images showing colocalization of 3xHA tag and NKCC1 in P0 ChP. Scale bar = 50 µm, representative of three independent experiments, each with two biological replicates. f–i Immunofluorescence images of HA in AAV2/5-NKCC1 transduced brain at P1: LVChP (f), 3rd ventricle ChP (3VChP) (g), 4VChP (h), and the spinal cord (i sc = spinal cord). Trace expression of HA in the meninges near the injection site (gray arrow). Scale bar = 500 µm. f–i are representative of two independent experiments, each with three biological replicates. j ICP-OES measurements of CSF [K+] from AAV-NKCC1 vs. AAV-GFP P1 mice (N = 8 in AAV-GFP cohort; N = 7 in AAV-NKCC1 cohort). **p = 0.0033; Welch’s two-tailed unpaired t-test. All quantitative data are presented as mean ± SD. Source data are provided as a Source Data file.

