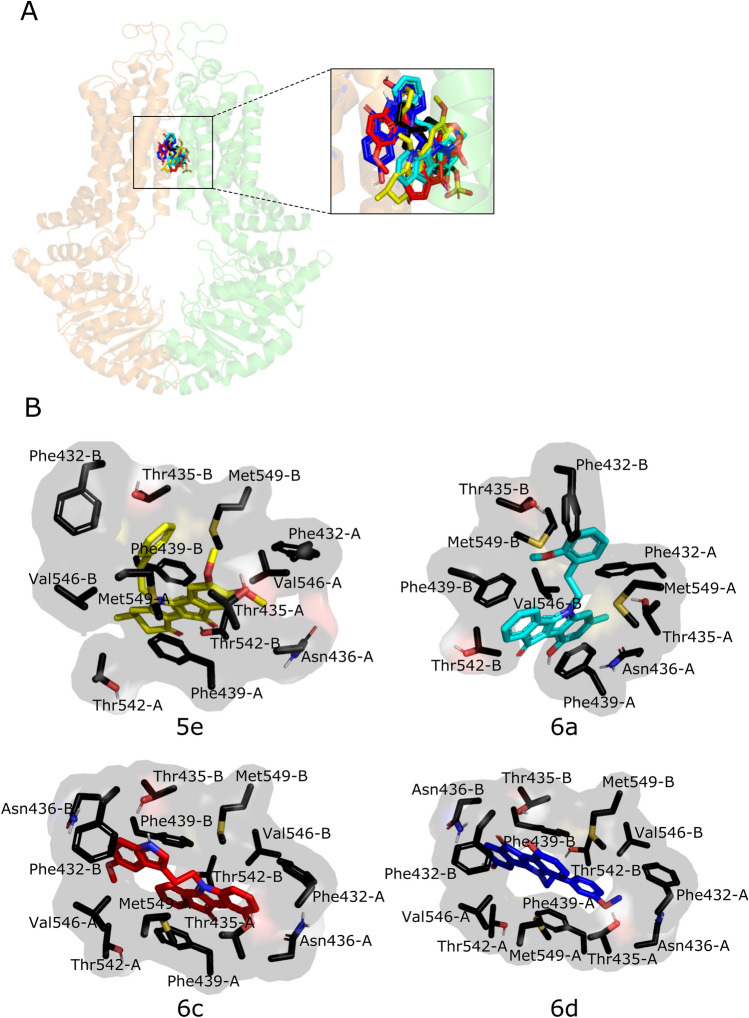
Figure 7.
Docking analysis in human ABCG2 (PDB 6HCO). (A) Representative docking poses of the inhibitors overlapping the binding site of estrone-3-sulfate (E3S – black, 6c—red, 6d—blue, 6a—cyan and 5e—yellow), in stick representation. The two monomers are colored differently, orange (chain A) and green (chain B). (B) Interacting residues on the best energy score pose of the inhibitors are represented as stick models. The images were generated using the program PyMOL Molecular Graphics System, Version 1.2r3pre, Schrödinger, LLC (URL: https://pymol.org/2/).

