
Figure 1.
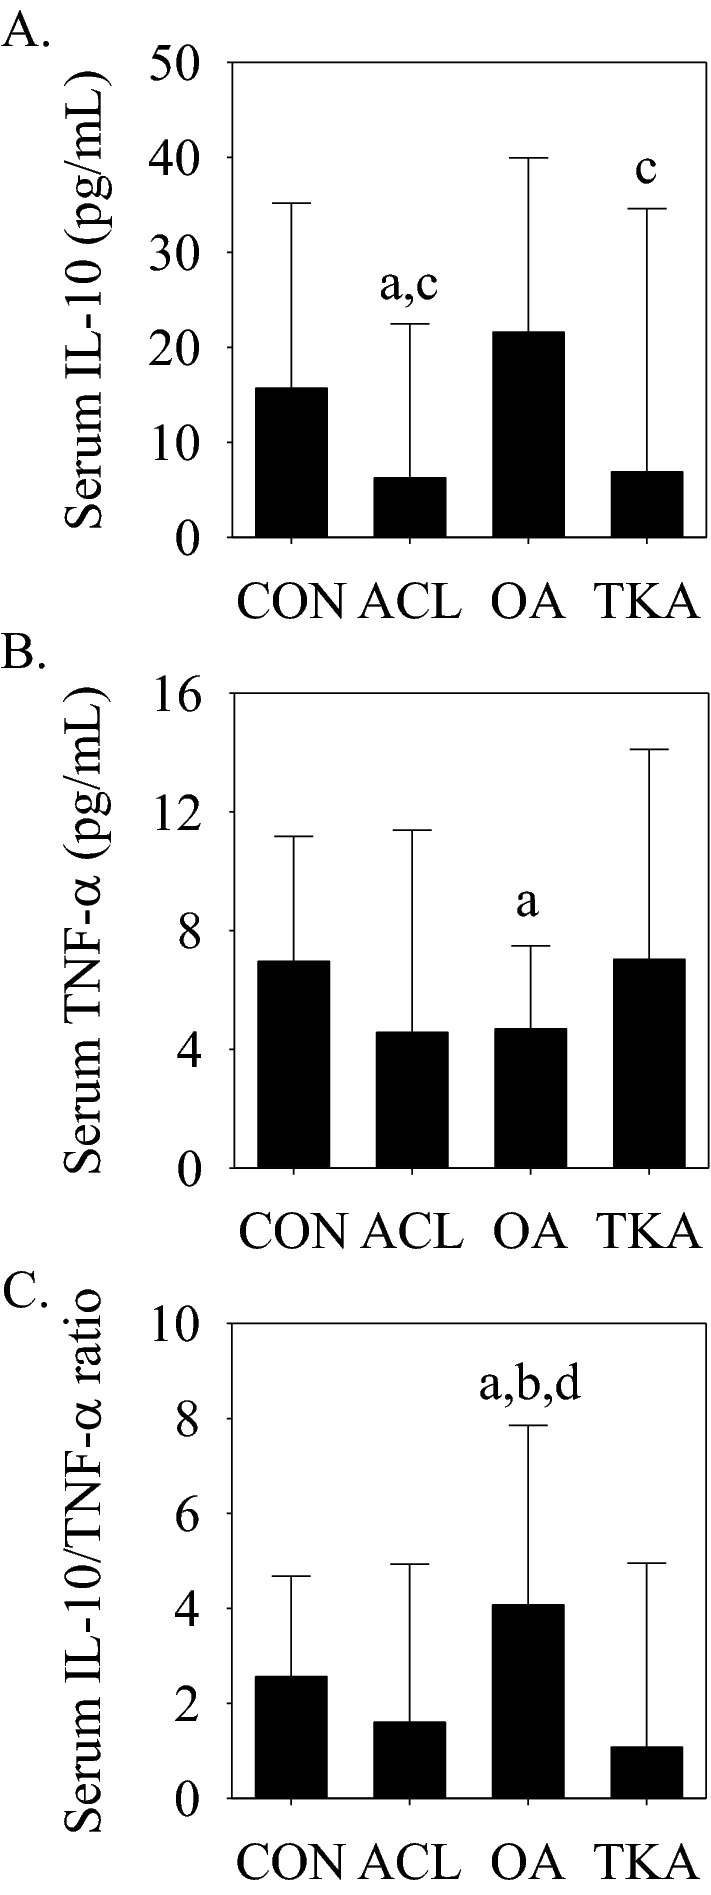
Serum IL-10 and TNF-α concentrations and the serum IL-10/TNF-α ratio in the CON, ACL, OA, and TKA groups. (A) Serum IL-10 concentrations were significantly lower in the ACL (ap < 0.05 vs. CON and cp < 0.05 vs. OA) and TKA (cp < 0.05 vs. OA) groups. (B) Serum TNF-α concentrations were significantly (ap < 0.05 vs. CON) lower in the OA group. (C) The serum IL-10/TNF-α ratio was significantly (ap < 0.05 vs. CON, bp < 0.05 vs. ACL, and dp < 0.05 vs. TKA) higher in the OA group. Data presented as median (interquartile range).