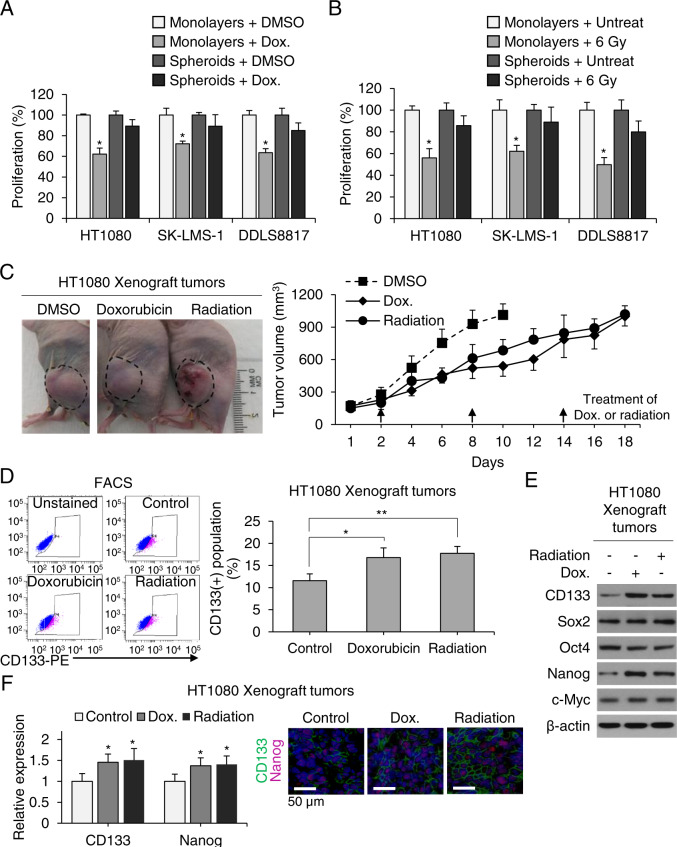
Fig. 2. CSCs contribute to sarcomas’ resistance to chemo- and radiotherapy.
A, B Proliferation of monolayers and spheroids following treatment with doxorubicin (Dox) or radiation therapy. C Growth curve of HT1080 fibrosarcoma xenografts in athymic nude mice treated with Dox or 6 Gy radiation. D Fluorescence-activated cell sorting (FACS) analysis for CD133+ cells in untreated control and Dox- or 6-Gy-treated tumors. E Western blot of tumor lysates for CD133, Sox2, Oct4, Nanog, and c-Myc. β-Actin is the loading control. F Immunofluorescence of tumors for CD133 (green) and Nanog (red) with DAPI (blue) staining in athymic nude mice treated with doxorubicin or 6 Gy radiation. Scale bar, 50 µm. *p < 0.05, **p < 0.01 compared to control.

