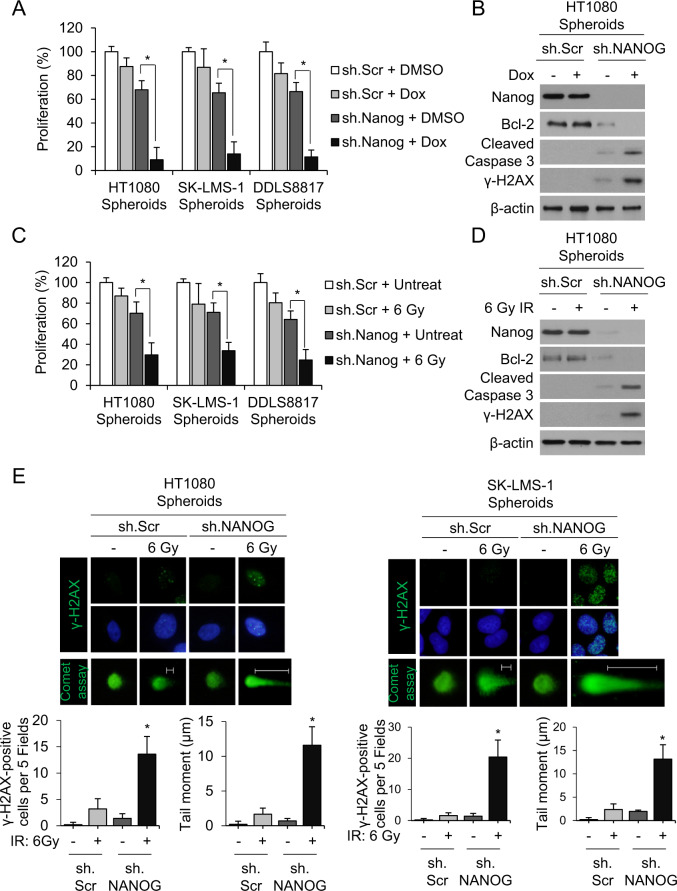
Fig. 3. Nanog inhibition reverses chemo- and radiotherapy resistance.
A–D Proliferation of sarcoma cells grown as spheroids (A, C) and western blot for Nanog, Bcl-2, cleaved caspase-3, and γ-H2AX (B, D) following treatment with sh.NANOG or sh.Scr and doxorubicin (Dox) or 6 Gy radiotherapy. β-Actin, loading control. *p < 0.01 compared to control. E Immunofluorescence of sarcoma spheroid cells (HT1080, SK-LM-1). Top panel shows γ-H2AX in green. Middle panel shows γ-H2AX in green and nuclei in blue (DAPI). Bottom panel shows Comet assay in green. All photos are of different cells under specified conditions. Graphs show quantification of γ-H2AX positive staining and mean tail moment. Nuclei were stained with DAPI (4′,6-diamidino-2-phenylindole; blue).

