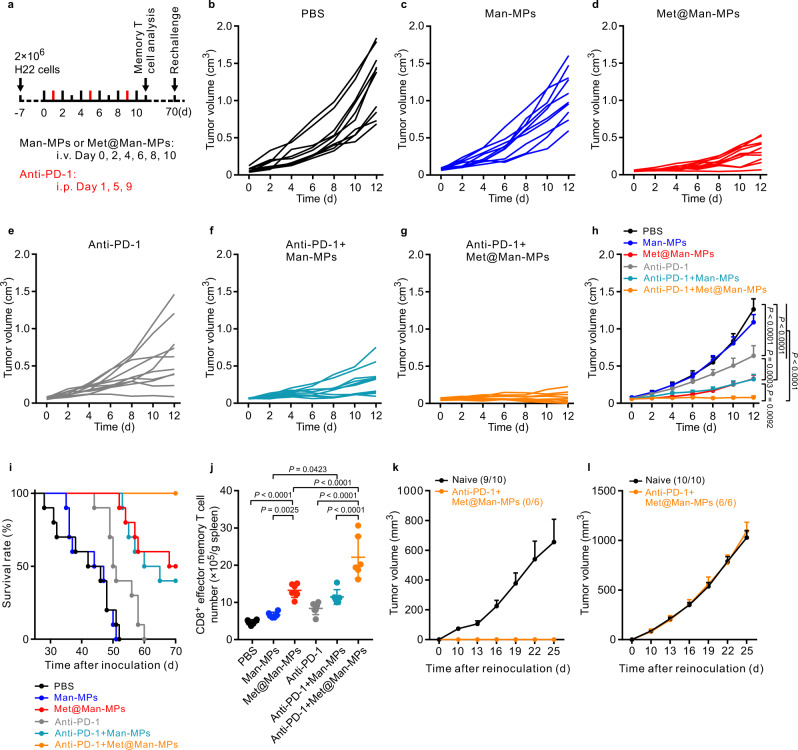
Fig. 8. Anticancer activity of combination of anti-PD-1 antibody and Met@Man-MPs in H22 tumor-bearing mice.
a Schematic schedule for an anticancer experiment in H22 tumor-bearing mice. b–g Individual tumor growth curves of H22 tumor-bearing mice after treatment with PBS (b), Man-MPs (c), Met@Man-MPs (d), anti-PD-1 antibody (e), a combination of Man-MPs and anti-PD-1 antibody (f), or combination of Met@Man-MPs and anti-PD-1 antibody (g) at the anti-PD-1 antibody dosage of 100 µg per mouse and Met dosage of 10 mg kg−1 indicated in (a). h Average tumor growth curves of H22 tumor-bearing mice indicated in a. Data are presented as mean ± s.e.m. (n = 10 mice per group; two-way ANOVA followed by Bonferroni’s multiple comparisons post-test). i Kaplan–Meier survival plot of H22 tumor-bearing mice after treatment indicated in (a) (n = 10 mice per group). j The numbers of CD8+ effector memory T cells (CD3+CD8+CD44+CD62L−T cells) in spleens of H22 tumor-bearing mice after treatment indicated in a. Data are presented as mean ± s.d. (n = 6 mice per group; one-way ANOVA followed by Tukey’s HSD post-hoc test). k, l Tumor growth curve after rechallenge with H22 cells (3 × 10⁶ cells, k) and 4T1 cells (1 × 10⁶ cells, l) in naïve mice or combination of anti-PD-1 antibody and Met@Man-MPs-treated mice indicated in (a). The ratio of mice with tumorgenesis is indicated in the brackets. Data are presented as mean ± s.e.m. (n = 10 for naive mice, n = 6 for anti-PD-1 antibody- and Met@Man-MPs-treated mice). Source data are provided as a Source Data file.

