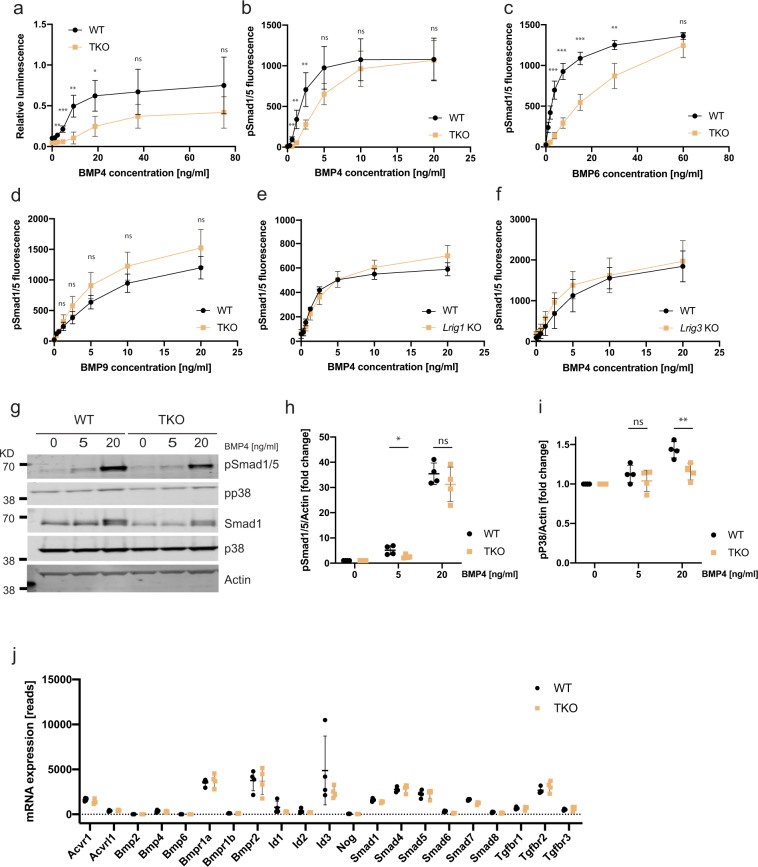
Fig. 2. Lrig-null MEFs show impaired BMP signaling without any apparent changes in the expression of receptors or signaling mediators.
a Wild-type (WT) and Lrig-null (TKO) MEFs expressing the BMP reporter plasmid pGL3-BRE-luciferase were treated with the indicated concentrations of BMP4 for three hours. Thereafter, the cells were lysed, and the luciferase activity was analyzed and normalized to the control. b–d Wild-type and Lrig-null MEFs were stimulated with various concentrations of BMP4 (b), BMP6 (c), or BMP9 (d) for one hour followed by immunocytofluorescence analysis of nuclear phospho-Smad1/5 (pSmad1/5). e, f Wild-type and Lrig1-null MEFs (e) or wild-type and Lrig3-null MEFs (f) were stimulated with various concentrations of BMP4 for one hour followed by nuclear pSmad1/5 analysis. g–i Western blot analyses of canonical BMP4 signaling through pSmad1/5 and noncanonical BMP signaling through phosphorylated p38 (pp38). Wild-type and Lrig-null MEFs were stimulated with the indicated concentrations of BMP4 for one hour followed by cell lysis and Western blot analysis. Uncropped blots are shown in Supplementary Fig. 3. g Representative Western blots showing pSmad1/5, pp38, total Smad1, total p38, and the loading control actin. h Quantification of the pSmad1/5/actin ratios. i Quantification of the pp38/actin ratios. j Gene expression levels were analyzed in wild-type (WT) and Lrig-null (TKO) MEFs via RNA sequencing (RNAseq). The apparent number of RNAseq reads for respective gene is indicated. All the values in a–f, h and i represent the means of four biological replicates that were analyzed by three experimental repeats each. j The values represent the means of four biological replicates that were analyzed once. Error bars represent the standard deviations of means from four biological replicates. nsP > 0.05, *P < 0.05, **P < 0.01, ***P < 0.001 (Student’s t-test).

