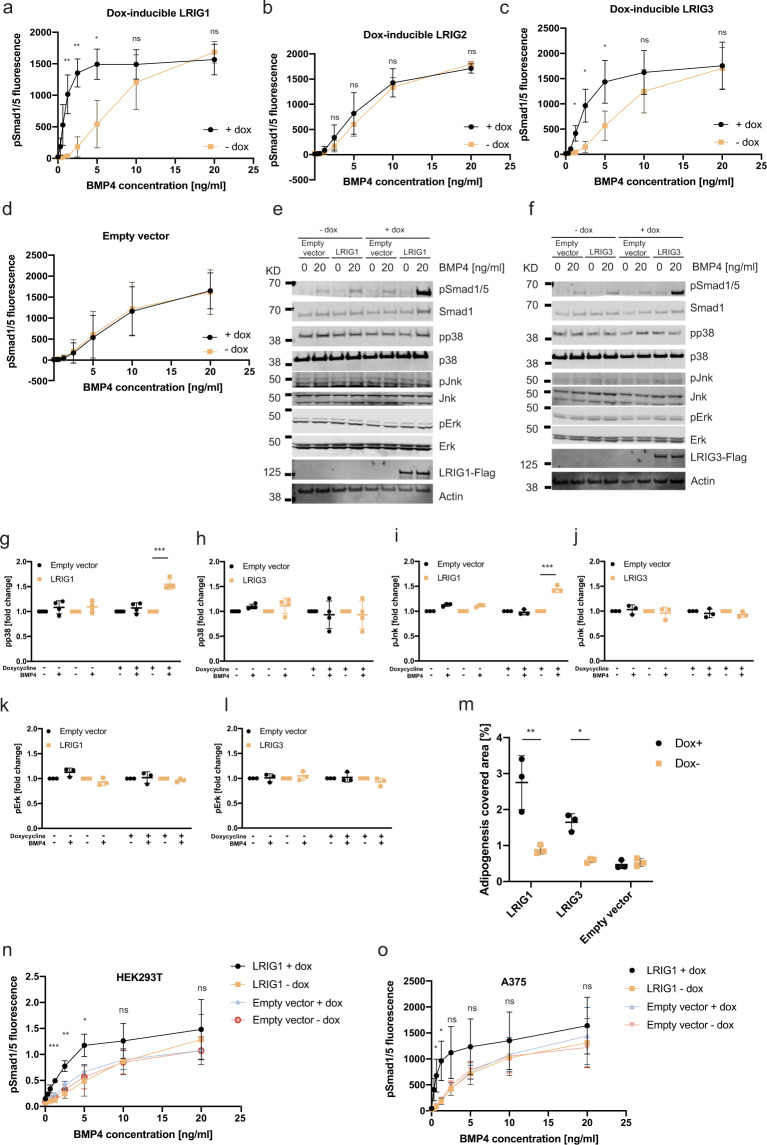
Fig. 3. Ectopic LRIG1 or LRIG3 resensitize Lrig-null cells to BMP4.
a–m Lrig-null MEFs were transduced with doxycycline-inducible LRIG1, LRIG2, or LRIG3 constructs or with empty vector as a noninducible control. LRIG protein expression was not induced or induced by treatment of the cells with 100 ng/ml (a–d, m–o) or 500 ng/ml (e–l) doxycycline for 24 h followed by stimulation of the cells with different concentrations of BMP4 for one hour (a–l, n, o) or with adipogenic cocktail for ten days (m). a–d Immunofluorescence analyses of nuclear pSmad1/5 in cells not induced (−dox) or induced (+dox) to express LRIG1 (a), LRIG2 (b), or LRIG3 (c). The empty vector served as a negative control for doxycycline treatment (d). e–l Western blot analyses of canonical (pSmad1/5) and noncanonical (pp38, pJnk, and pErk) BMP4 signaling. LRIG1- or LRIG3-inducible MEFs were induced, or not induced, with doxycycline followed by stimulation with 0 or 20 ng/ml of BMP4 for one hour. Thereafter, the cells were lysed, and the lysates were analyzed by Western blotting. e, f Representative Western blots showing pSmad1/5, total Smad1, pp38, total p38, pJnk, total Jnk, pErk, total Erk, LRIG1-FLAG (e), LRIG3-FLAG (f), and the loading control actin. Uncropped blots are shown in Supplementary Fig. 5. g–l Quantification of pp38 (g, h), pJnk (I, j), and pErk (k, l) normalized to actin in LRIG1-inducible (g, I, k) or LRIG3-inducible (h, j, l) MEFs. Plotted values in a–d represent means from three biological replicates, each with three experimental repeats. Error bars represent the standard deviations of means from three biological replicates. g, h Shown are four experimental repeats using an LRIG1- or LRIG3-inducible MEF line. Error bars show the standard deviations of the four means. i–l Shown are three experimental repeats using an LRIG1- or LRIG3-inducible MEF line. Error bars show standard deviations of the four means. m LRIG1 or LRIG3 expression was induced or not in Lrig-null MEFs with doxycycline followed by treatment of the cells with the adipogenic cocktail for ten days and quantification of adipocytes via Oil Red O staining. Shown are quantifications of the percentage area coverage for the Oil Red O stained biological replicates (n = 3 per genotype and treatment). n, o LRIG1 expression was induced or not in LRIG1-inducible HEK293T cells (n) and A375 cells (o) via the treatment of cells with doxycycline for 24 h, followed by stimulation with different concentrations of BMP4 for one hour. Immunofluorescence analyses of nuclear pSmad1/5 in HEK293T cells (n) or A375 cells (o) that were not induced (-dox) or induced (+dox) to express LRIG1, with empty vector serving as a noninducible control. Plotted values in n and o represent the means from three independent experiments, performed as triplicates using one biological replicate of each cell line. Error bars represent standard deviations from three means. nsP > 0.05, *P < 0.05, **P < 0.01, ***P < 0.001 (Student’s t-test).

