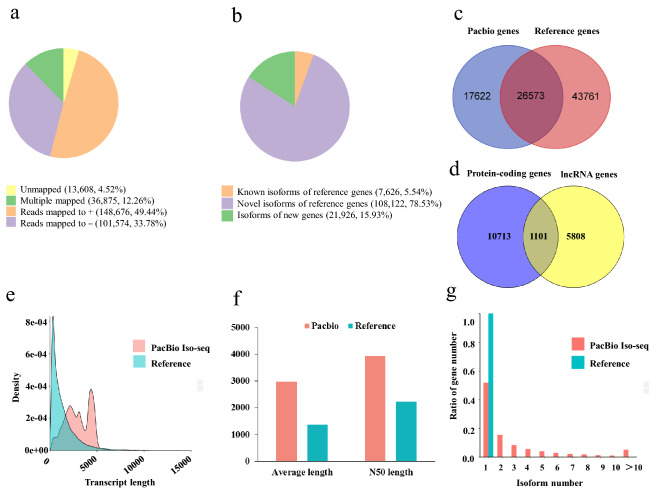
Figure 2.
GMAP mapping result and the comparison of goldfish transcript isoforms between the PacBio Iso-Seq and reference genome annotation. (a) Statistics of the consensus sequences mapped onto the reference genome. (b) Classification of transcript isoforms corresponding to the reference genome. (c) The comparison of gene numbers between Pacbio Iso-Seq and the reference genome annotation. (d) Classifications of novel gene loci identified in PacBio Iso-Seq. (e) The comparison of transcript length distribution between Pacbio Iso-Seq and the reference genome annotation. (f) Comparisons of the average length and N50 length of transcripts between Pacbio Iso-Seq and the reference genome annotation. (g) The comparison of transcript isoform number between Pacbio Iso-Seq and the reference genome annotation. The figures were constructed in ggplot2 (https://ggplot2.tidyverse.org).

