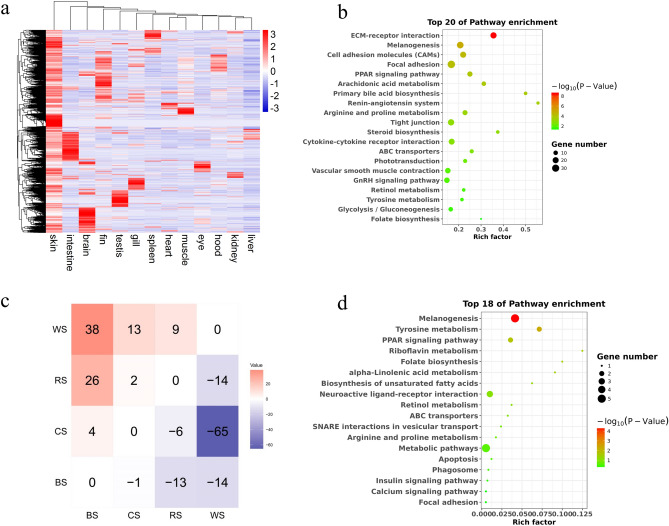
Figure 6.
Analyses of skin- and color-specific gene expressions. (a) Heatmaps of skin-specific gene expression. (b) Top 20 pathways enriched with skin-specific genes. (c) Comparisons of differentially expressed genes between four different color skins. (d) Top 18 pathways enriched with differentially expressed genes in different color skins. BS: black skin; CS: cyan skin; RS: red skin; WS: white skin. The figures were constructed in pheatmap R package 1.0.12 (https://CRAN.R-project.org/package=pheatmap) and ggplot2 (https://ggplot2.tidyverse.org).

