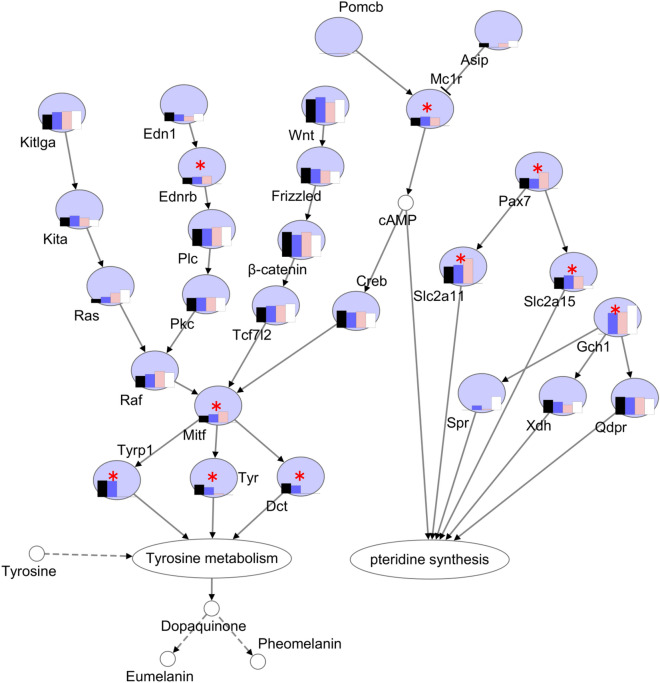
Figure 7.
The differentially expressed genes in the gene regulatory network of pigment synthesis. * indicates differentially expressed genes between four different color skins. Four color bars in each circle represent the relative expression level of each gene in four color skins. Solid arrow represents direct positive regulation, “T” shape solid line represents direct negative regulation, and dotted arrow represents indirect positive regulation. The figures were constructed in Microsoft Office PowerPoint.

