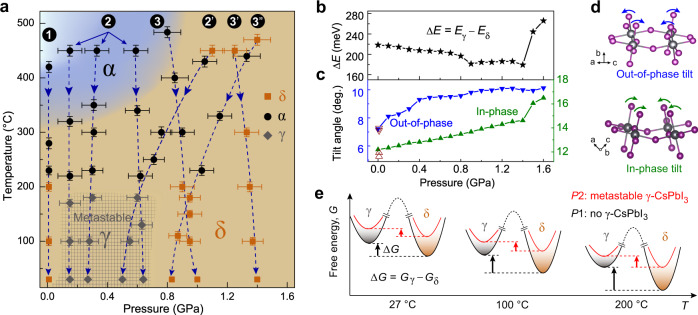
Fig. 3. Representative cooling routes and the effect of [PbI6]4− octahedral tilt on the energy difference between γ- and δ-CsPbI3 with pressure.
a The experimental cooling routes used to access and preserve γ-CsPbI3 to room temperature. The background color shows the P–T phase diagram of CsPbI3 that includes the δ and α phases. γ-CsPbI3 is not a thermodynamically stable phase and only forms during rapid cooling from high temperature marked as a gray crossed-hatched region. The numbers inside the black circles indicate different cooling routes. The temperature error bars are determined based on the temperature fluctuation before and after measurements, which further causes the pressure uncertainty (see “Methods” for details). b The total energy difference per unit cell between γ- and δ-CsPbI3 (ΔE = Eγ – Eδ) under compression. c The evolution of the calculated out-of-phase tilt along [101] and the in-phase tilt along [010] as a function of pressure. The open triangles are the previously reported tilt angles of γ-CsPbI3 at room temperature and ambient pressure10,13. d Ball-stick models visualizing the out-of-phase and in-phase octahedral tilts. e A schematic Gibbs free energy (G) diagram of γ- and δ-CsPbI3 as a function of temperature at pressure P1 (e.g., 0.8 and 1.6 GPa) without the formation of metastable γ-CsPbI3 (black curve) and at pressure P2 (e.g., 1.2 GPa) with the formation of γ-CsPbI3 (red curve). ΔG (= Gγ – Gδ) at 0.8, 1.2, and 1.6 GPa are 0.806, 0.589, and 0.941 eV at 27 °C, 0.934, 0.614, and 1.011 eV at 100 °C, and 1.128, 0.653, and 1.118 eV at 200 °C, respectively.

