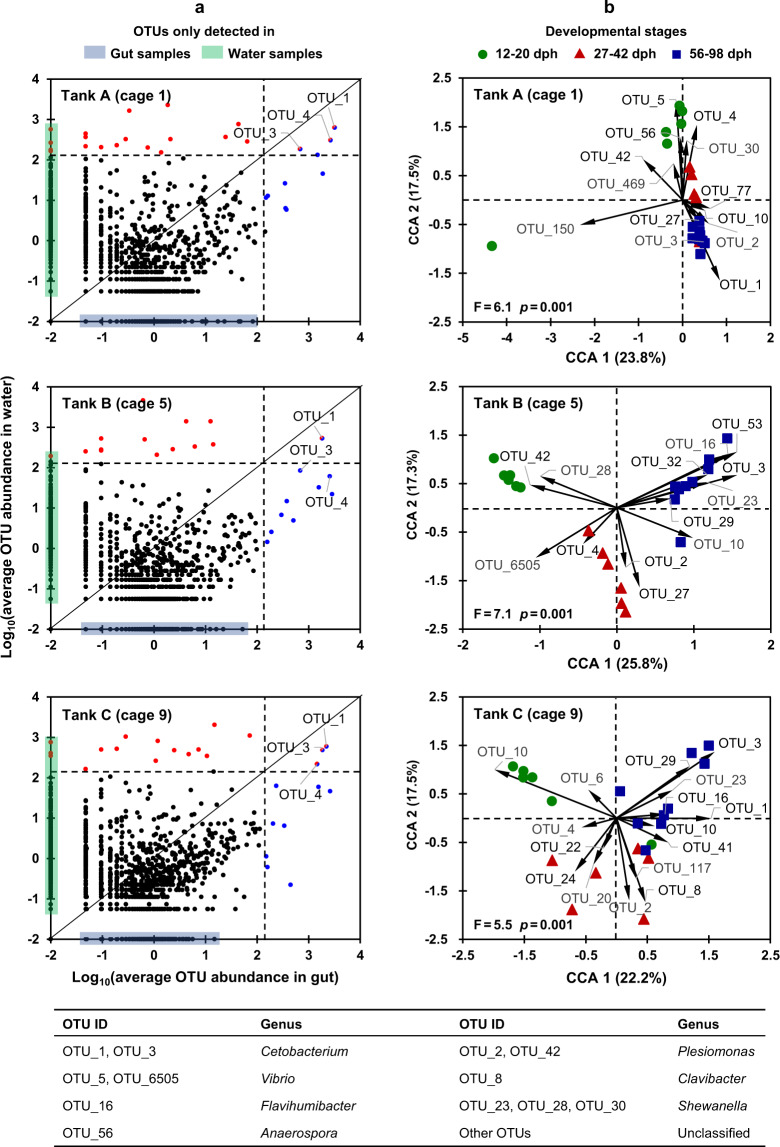
Fig. 3. The average abundance for each detected OTU and the variation of gut microbial communities explained by the top 20 OTUs.
a the average abundance for each OTU across water and gut microbiotas. The microbial OTUs that were equally abundant in gut and water samples fall along the diagonal line, whereas those enriched in the water or gut samples fall above or below the line, respectively. Dashed lines marked 1% of the average abundance in water or gut samples, respectively. The OTUs averagely >1% in gut or water samples are shown in blue and red, respectively. The red and blue mix points indicate OTUs dominated in both gut and water microbiotas, and the black points indicate OTUs averagely <1% in gut or water samples. b canonical correspondence analysis (CCA) showing gut microbiota variation explained by the top 20 OTUs. Each point represents a gut microbial community of individual zebrafish, and arrows represent the contribution of the top 20 bacterial OTUs.

