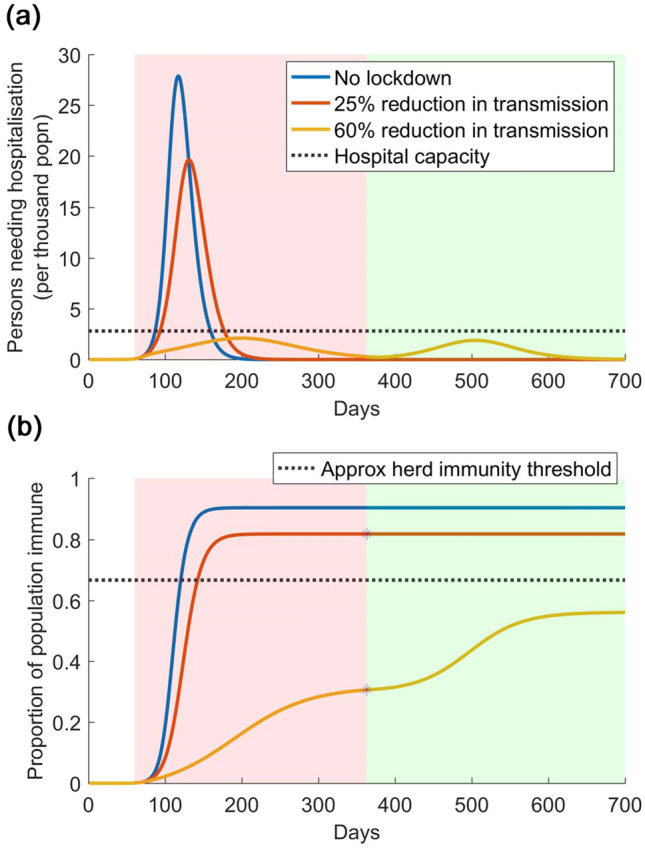
Figure 2.

Illustration of lockdown release, when accompanied by a test-and-isolate strategy. (a) Scenarios are as in Fig. 1, but here assuming that—2 weeks prior to the lifting of the lockdown—PCR testing in the community is sufficiently ramped up to identify and isolate all symptomatics within, on average, 4 days on symptom onset. As in Fig. 1, the pink shaded area denotes the duration of the lockdown; the green shaded area denotes the period when the lockdown is lifted, and the test-and-isolate strategy is implemented in its place. In the event that the lockdown has been effective in reducing transmission (yellow curve), such a strategy succeeds in preventing the resurgent epidemic from overwhelming healthcare capacity. (b) In the event that the lockdown has been less effective (red curve), such a strategy has little additional value for epidemic control, since population immunity is already sufficiently widespread to interrupt transmission (lower panel).
