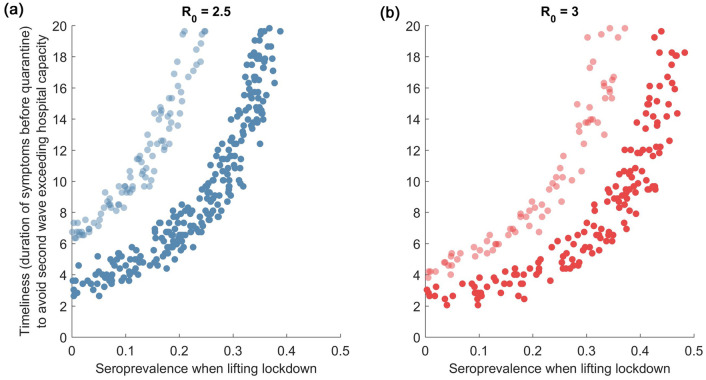
Figure 4.
Sensitivity analysis to R0, and to testing strategy. Graphs are constructed as in Fig. 3, left-hand panel. Figure shows results for R0 = 2.5 (a) and for R0 = 3 (b). The band of dark-shaded points corresponds to a strategy where only symptomatic cases are tested and isolated. The band of light-shaded points corresponds to a strategy where 50% of asymptomatic cases are additionally tested and isolated, before they recover or develop symptoms. As in Fig. 3, the vertical axis denotes the timeliness with which symptomatic cases need to be identified and isolated, in order to prevent a resurgent epidemic from overwhelming the health system.

