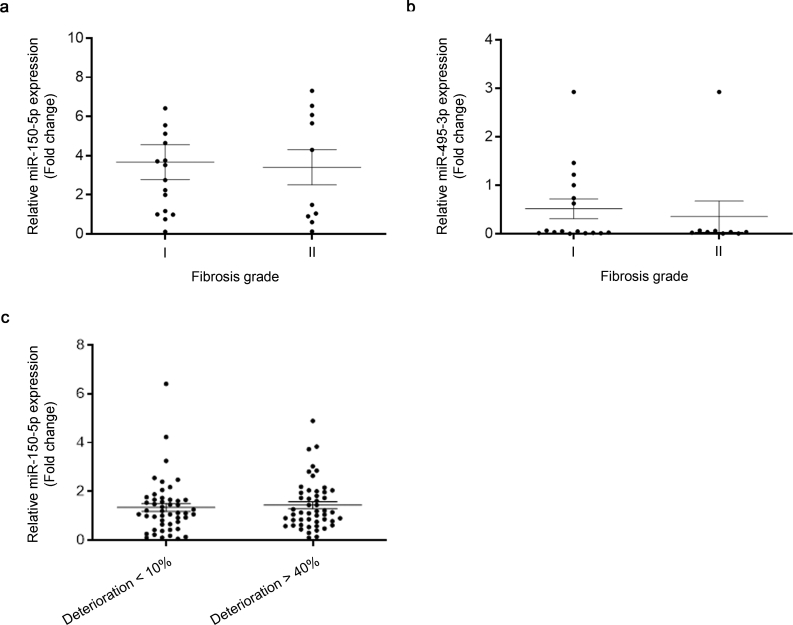
Supplementary Fig. 4.
MiR-150-5p and miR-495-5p levels in kidney samples and plasma from CKD patients. (A) miR150-5p expression levels in 26 human post-transplant renal biopsies with different fibrosis grade were determined by qRT-PCR using Sybr green. (B) miR-495-3p expression levels from the same biopsies as in (A) were determined by qRT-PCR using Sybr green. (C) miR-150-5p circulating plasma levels in a cohort of 100 CKD patients with different kidney function deterioration were determined by qRT-PCR using Sybr green.

