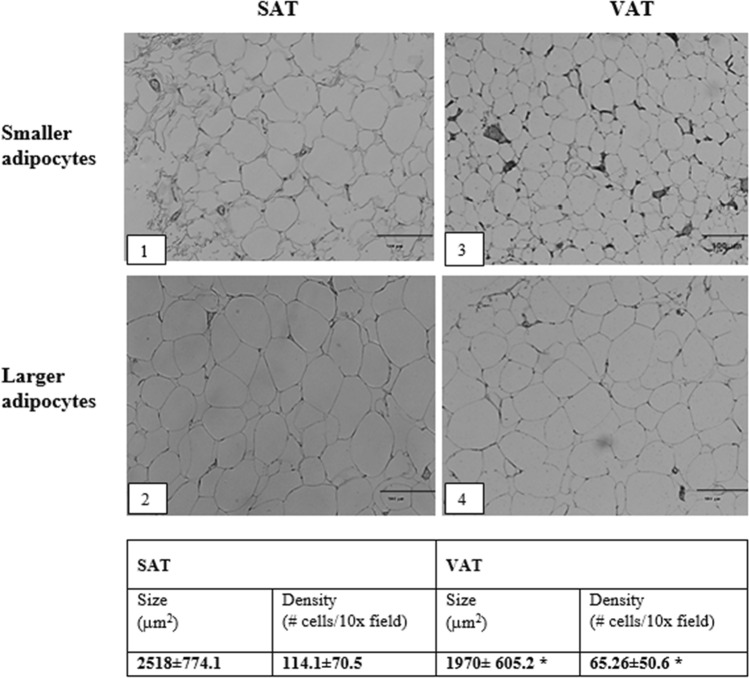
Figure 1.
Characterization of adipose tissue (adipocytes size and density). The figure shows a representative image of SAT, including smaller adipocytes (1) and larger adipocytes (2) as well as representative image of VAT including smaller adipocytes (3) and larger adipocytes (4). Results are shown as mean ± standard deviation. SAT, subcutaneous adipose tissue; VAT, visceral adipose tissue. (*) = statistical difference p < 0.05, one-tail, T-test. Images in the figure were analyzed with the software Image J. (v. 1.53g). URL: https://imagej.nih.gov/ij.

