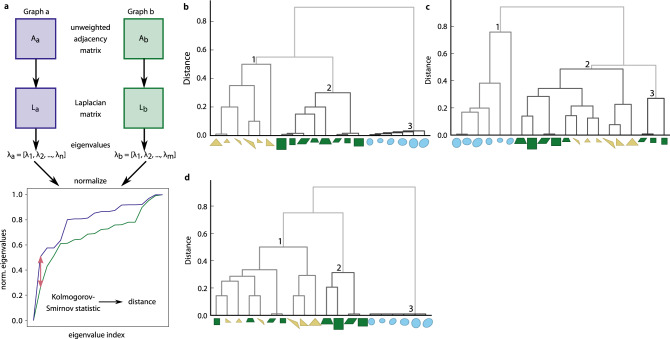
Fig. 2. Comparison of unweighted visibility graphs.
a Two visibility graphs are compared based on the spectrum (i.e., distribution of eigenvalues) λ of the Laplacian L obtained from the unweighted adjacency matrices A. The Kolmogorov–Smirnov statistic is used to quantify the difference between the distributions of two spectra. b–d Clustering dendrogram obtained by the procedure for a set of synthetic, simple triangular, circular, and rectangular shapes with b the same number of nodes, c variable number of nodes between the network representations of the shapes, and d variable number of nodes which were reduced using modularity clustering to have the same number of nodes. Source data are provided as a Source Data file.

