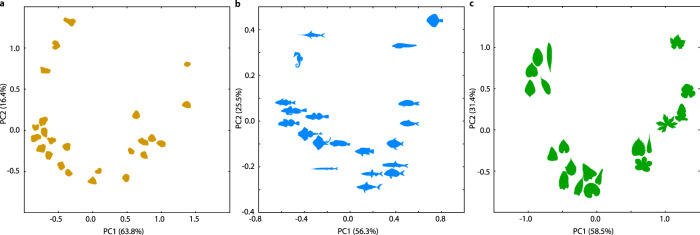
Fig. 3. Comparison of shapes from different domains based on their visibility graphs.
The distances between visibility graphs based on the spectra of their Laplacians can be used in multivariate analyses and visualizations to distinguish different groups of similar shapes. We show the principal component analyses of shapes from three different domains: a sand grains, b fish shapes, and c leaf shapes13,31,32. Source data are provided as a Source Data file.

