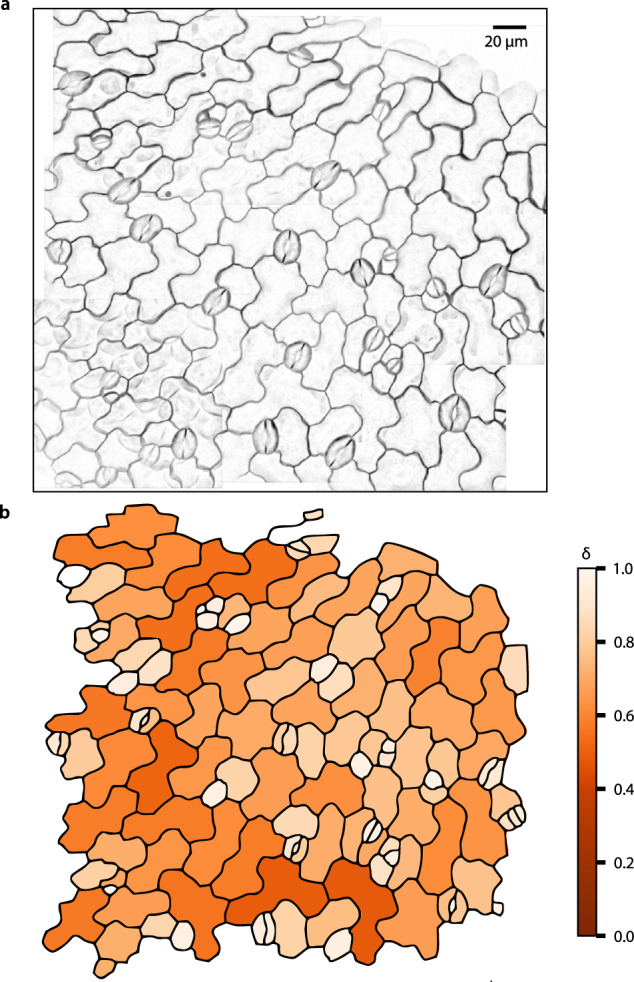
Fig. 4. Heatmap of Arabidopsis pavement cell completeness.

a Example microscopy image of Arabidopsis pavement cells at 96 h after germination (single image). b The original microscopy image can be recreated by plotting the extracted visibility graphs of all detected pavement cells and weighting them according to their relative completeness (δ), which is calculated by the relative density of the corresponding visibility graphs. Simple, round shapes like stomata have smaller relative completeness (white) in comparison to the more complex pavement cell shapes (dark orange). Source data are provided as a Source Data file.
