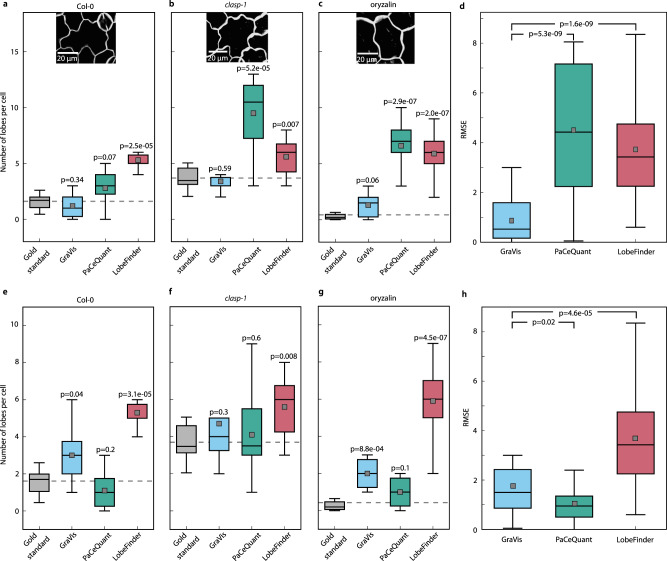
Fig. 6. Comparison of visibility graphs with other contending approaches to counting the number of lobes without tri-cellular junctions in leaf pavement cells.
The comparison involves three computational approaches: PaCeQuant14, based on the contour curvature, LobeFinder6, based on the convex hull, and LOCO-EFA15, based on elliptical Fourier analysis. Since LOCO-EFA does not distinguish between true lobes and tri-cellular junctions, it was removed from the comparison, but is included in the comparison of tools based on the total number of lobes (Supplementary Fig. 15). The quantitative comparison is based on a gold standard that includes n = 30 Arabidopsis pavement cells obtained from each of the three scenarios: a, e wild type, b, f clasp-1 mutant, and c, g oryzalin treatment, all with manually annotated lobes by 20 experts. The clasp-1 data used for the gold standard (96 h after germination) differ from the clasp-1 data used in the comparison of different genotypes (120 h post dissection), as the images were captured at different time points. Shown is the competitive comparison using a–d default parameters and e–h tuned parameters to detect the number of lobes without tri-cellular junctions. The dotted line denotes the mean of the gold standard, i.e., manual detection by 20 experts, for the respective scenario. While GraVis performs best based on the residual mean square error (RMSE) using d default parameters, it performs as good as PaCeQuant using h tuned parameters. p values were determined with a two-sided two-sample t test and were Benjamini–Hochberg adjusted. Boxplots are shown with median (horizontal line), mean (gray square), 25th and 75th percentiles (box edges), and 1.5-fold of the interquartile range (whiskers). Source data are provided as a Source Data file.

