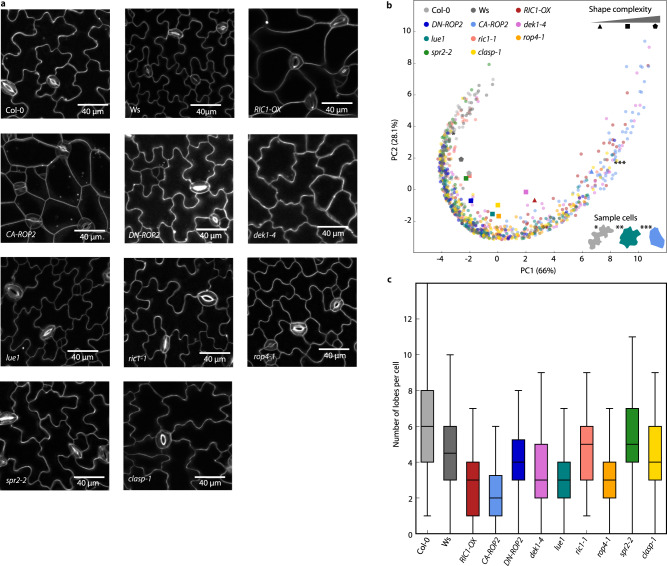
Fig. 7. Comparison of pavement cells based on visibility graphs distinguishes Arabidopsis wild-type and genetically modified lines.
a Images of LTi6b-GFP expressing Arabidopsis wild-type (Col-0, WS) and genetic lines (RIC1-OX, CA-ROP2, DN-ROP2, dek1-4, lue1, ric1-1, rop4-1, spr2-2, clasp-1). For all genetically modified lines we captured six images, for DN-ROP2 we captured four images. b PCA of distances (n = 80 pavement cells per sample from different images) between pavement cells of wild-type Col-0 and WS (light gray and dark gray, respectively) and expression lines: RIC1-OX (red), CA-ROP2 (light blue), DN-ROP2 (dark blue), dek1-4 (pink), lue1 (teal), ric1-1 (salmon), rop4-1 (orange), spr2-2 (green), and clasp-1 (yellow). The circles correspond to selected cells, and the other shapes denote the center of mass for the corresponding expression lines. We used triangles for genetic lines with simple cell shapes (RIC1-OX, DN-ROP2), pentagons for very complex shapes (Col-0, Ws), and squares for shapes in between. Sample cells for Col-0 (light gray), CA-ROP2 (light blue), and lue1 (teal) and are shown in the lower right corner. c Boxplot of a number of detected lobes for wild-type and mutants (80 pavement cells per sample). Boxplots are shown with median (horizontal line), 25th, and 75th percentiles (box edges), and 1.5-fold of the interquartile range (whiskers). Source data are provided as a Source Data file.

