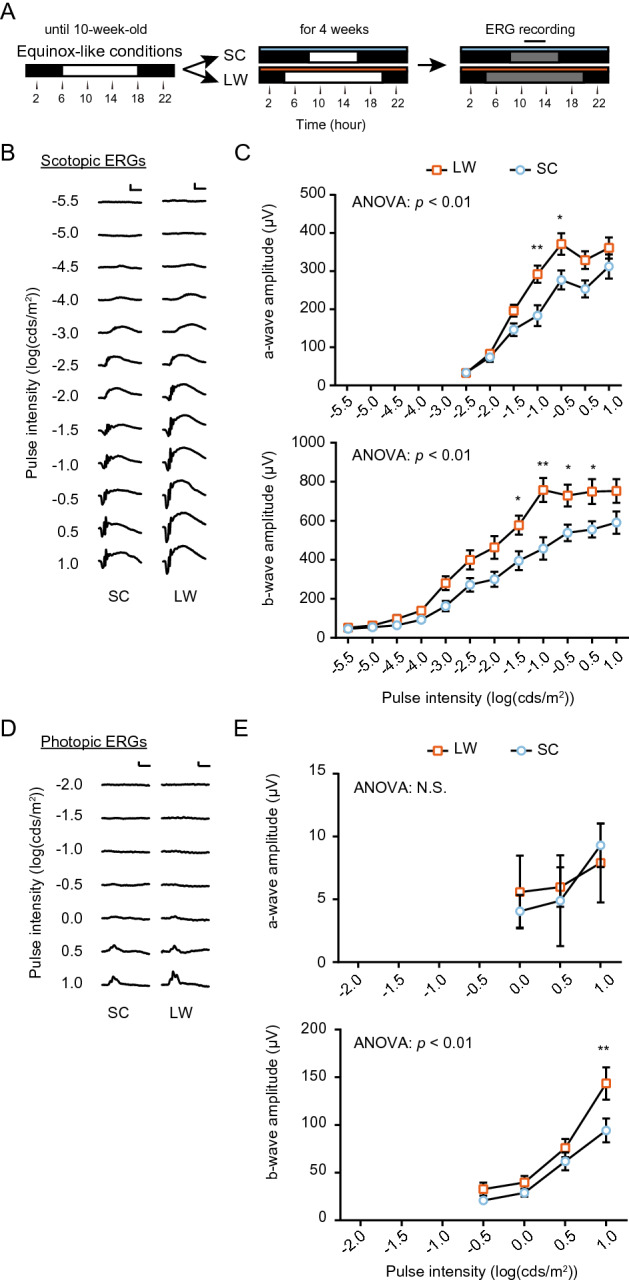
Figure 1.

Seasonal changes in the mesopic ERG response in mice. (A) Flow of the experiment for ERG recording. Black and white bars indicate dark and light periods, respectively. Blue and orange bars indicate cool (10 °C) and warm (27 °C) conditions, respectively. SC: short day and cool temperature (winter-like condition); LW: long day and warm temperature (summer-like condition). ERG recording was conducted at around midday (black solid line) under darkness (gray bar) (i.e., dark adaptation). (B) Scotopic pulse ERGs elicited using 12 different intensities (from − 5.5 to 1.0 (log cds/m2)) in SC and LW mice (scale bar: 200 µV [vertical], 50 ms [horizontal]). (C) Intensity–response curves of mean scotopic a- and b-wave amplitudes. (Two-way ANOVA, effect of seasonal cues, F(1, 154) = 23.73, p < 0.01 [a-wave]; F(1, 264) = 57.19, p < 0.01 [b-wave], Bonferroni post hoc test: *p < 0.05, **p < 0.01; effect of pulse intensity, F(6, 154) = 64.55, p < 0.01 [a-wave], F(11, 264) = 72.29, p < 0.01 [b-wave]; effect of interaction, F(6, 154) = 1.901, p = 0.0840 [a-wave], F(11, 264) = 2.326, p < 0.01 [b-wave], means ± SEM, n = 12 [animal]). (D) Photopic pulse ERGs elicited using different intensities (from − 2.0 to 1.0 log (cds/m2)) in SC and LW mice (scale bar: 50 µV [vertical], 50 ms [horizontal]). (E) Intensity–response curves of mean photopic a- and b-wave amplitudes (two-way ANOVA, effect of seasonal cues, F(1, 66) = 0.03748, p = 0.8471 [a-wave]; F(1, 88) = 10.06, p = 0.0021 [b-wave], Bonferroni post hoc test: **p < 0.01; effect of pulse intensity, F(2, 66) = 1.284, p = 0.2838 [a-wave], F(3,88) = 38.56, p < 0.01 [b-wave]; effect of interaction, F(2,66) = 0.1947, p = 0.8236 [a-wave], F(3,88) = 1.877, p = 0.1394 [b-wave], mean ± SEM, n = 12 [animal]).
