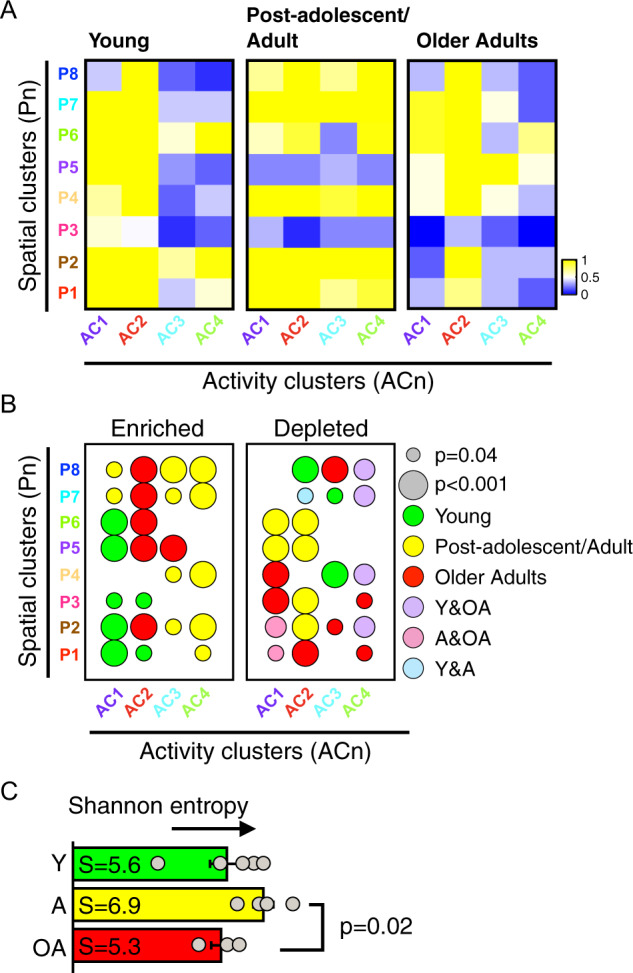
Fig. 4. Spatial and activity clusters define age-dependent cell motility states.

A Heatmaps showing the frequency per motility state defined by the eight spatial and four activity clusters: young (A02, A03, A09, A11, and A16), post-adolescent/adult (A29, A35, A45, and A55), and older adults (A65, A85, and A92). Color scales indicate the frequencies of cells within each motility state, yellow denotes high frequencies and blue denotes low frequencies. B Enrichment and depletion maps corresponding to motility states as a function of age-group. Size of the node denotes the magnitude of the p-value, and colors denote young (green), post-adolescent/adults (yellow), older adults (red). C Quantification of the Shannon entropy based on age-group defined motility landscapes.
