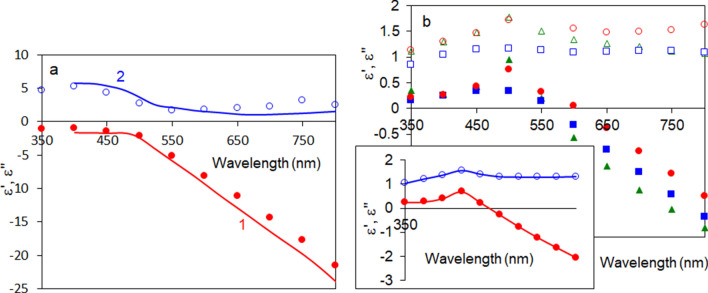
Figure 7.
(a) Spectra of the real (red trace 1 and solid circles) and imaginary (blue trace 2 and open circles) parts of the dielectric permittivity of Au. Solid line—the data from Refs.55,56, characters—the data derived from the experiment. (b) Spectra of real (closed characters) and imaginary (open characters) parts of dielectric permittivity of a single-layer Au nanoleaf (164 nm, red circles), two-fold Au nanoleaf (230 nm, blue squares) and four-fold Au nanoleaf (404 nm, green triangles). Inset: average of the three spectra of dielectric permittivities depicted in the main frame; red closed circles—real parts of dielectric permittivity ε′, blue open circles—imaginary parts of dielectric permittivity ε″.

