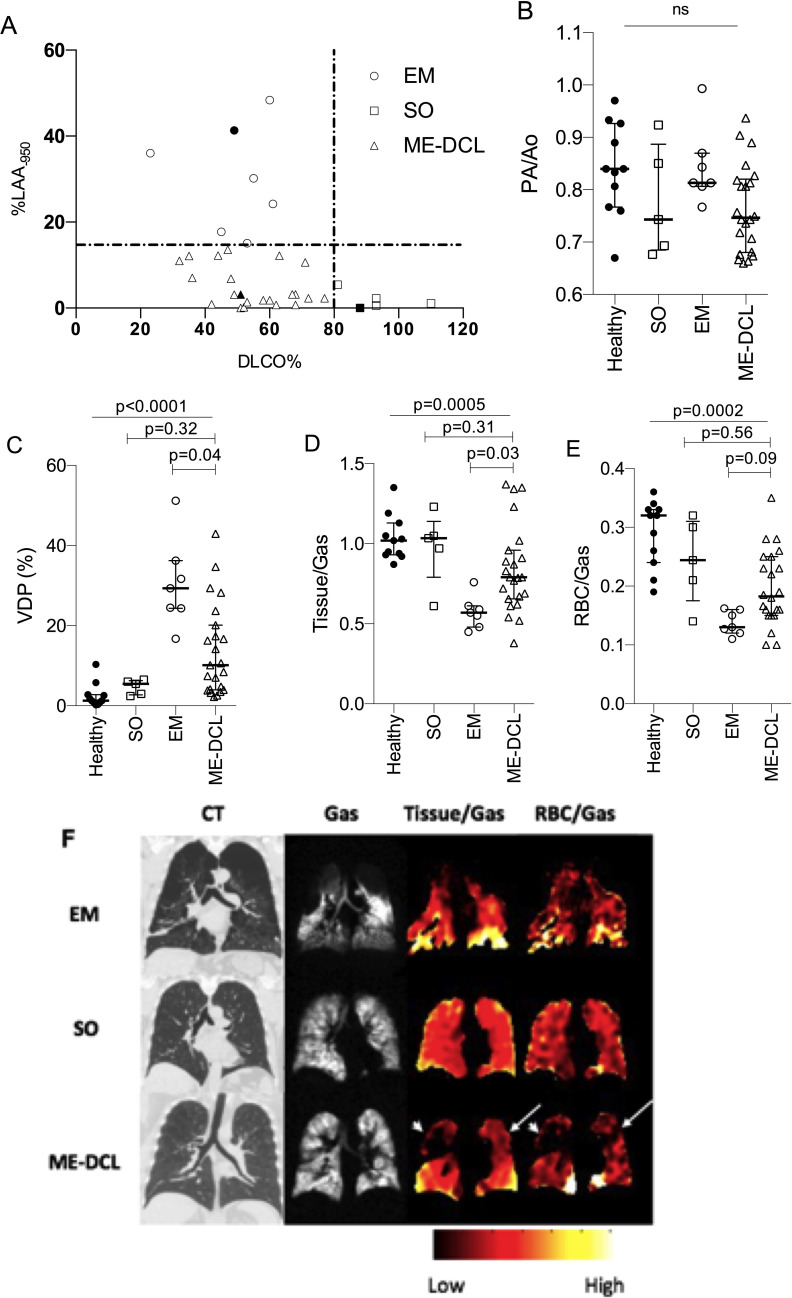
Figure 3.
(A) Grouping COPD phenotypes by per cent predicted value of carbon monoxide diffusion capacity (%DLCO) and per cent of the lung with emphysematous changes detectable by % Low Attenuation Area less than -950 Hounsfield Unit (%LAA-950) by MDCT. Vertical line shows cut-off of 80% predicted value of %DLCO. Horizontal line shows cut-off of 15% value for %LAA-950. em, denoted by ‘O’ symbol, represents subjects with EM phenotype (%DLCO ≦80% and %LAA-950≧15%). SO, denoted by ‘□’ symbol, represents subjects with minimal emphysema extent and preserved DLCO (%DLCO ≧80 and %LAA-950 <15). Minimal Emphysema-Diffusion Capacity Limitation (ME-DCL), denoted by ‘△’ symbol, represents subjects with minimal emphysema but disparately impaired diffusion capacity (%DLCO <80% and %LAA-950 <15%). (B) Pulmonary artery diameter to aorta diameter ratio (PA/Ao) in healthy (x), em (○), so (□), and ME-DCL (△) groups. (C) Ventilation defect percentage (VDP), (D) Tissue-to-gas ratio and (E) RBC-to-gas ratio in healthy (x), em (○), SO (□), and ME-DCL (△) groups. Kruskal-Wallis analysis was performed for multigroup comparison and Dunn’s multiple comparisons between ME-DCL and EM or ME-DCL and SO in the C–E. Representative images for subjects denoted with symbols ‘●’, ‘■’ and ‘▲’ are presented in F. (F) Images of individuals from each of the three subgroups. White arrow heads indicate matched tissue/gas and RBC/gas defects. White arrows indicate isolated RBC/gas defect. COPD, chronic obstructive pulmonary disease; EM, emphysema-predominant; MDCT, multidetector chest CT; ns, not significant; RBC, red blood cell; SO, simple obstruction.

