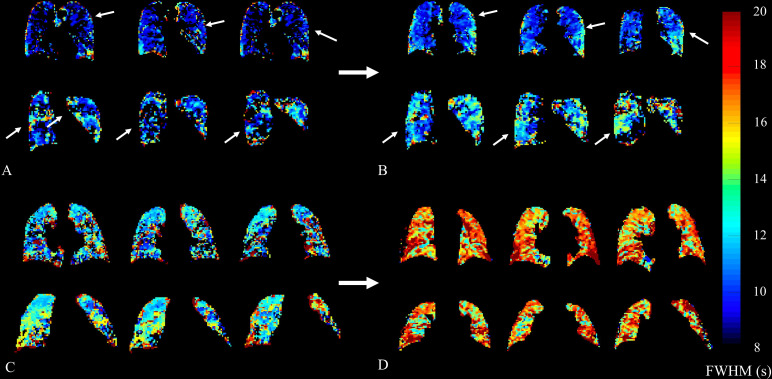
Figure 4.
Representative parametric transit time (FWHM) maps from two participants each with baseline (A and C) and follow up (B and D) scans. Participant 12 (A and B) demonstrates an increase in FWHM in the right lower lobe and left mid-zone peripheral lung tissue. FWHMmean decreased slightly by 0.13 s, with associated changes in FVC from 60.1% to 63.2%, and TLCO from 37.1% to 33.0%, respectively. Participant 18 (C and D) shows a gross overall increase in FWHM, again worse in peripheral lung tissue. FWHMmean increased by 4.35 s, in spite of both FVC and TLCO remaining relatively stable from 76.0% to 74.5%, and from 87.2% to 88.2%, respectively. Colour bar denotes FWHM in seconds. FVC, forced vital capacity; FWHM, full width at half maximum; FWHMmean, mean FWHM;TLCO, diffusingcapacity of the lungs for carbon monoxide.

