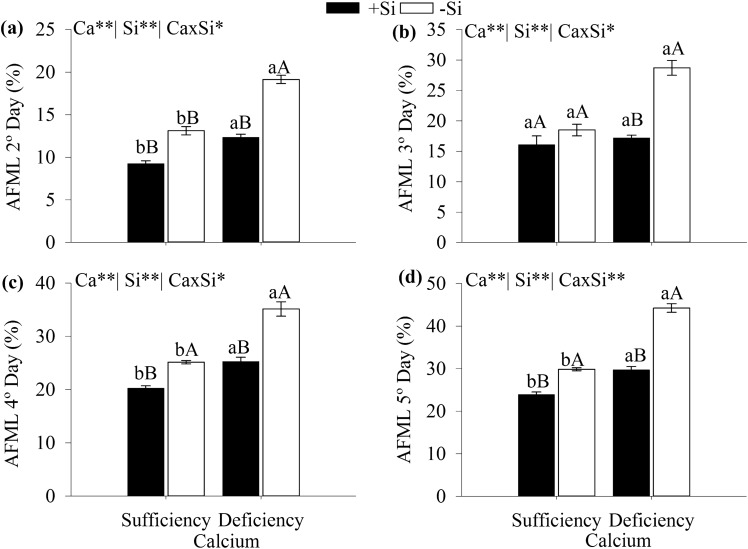
Figure 6.
Accumulated fresh matter loss of cabbage under Ca sufficiency and deficiency, with (− Si) and without Si (+ Si), determined on the second (a), third (b), fourth (c), and fifth (d) day after harvesting. F test was applied: *(p ≤ 0.05) and **(p ≤ 0.01). The student t means comparison test was applied. Lowercase letters (a,b) indicate significant differences to calcium within the same level as Si (p < 0.05). Uppercase letters (A,B) indicate significant differences for silicon within the same level as Ca (p < 0.05). The bars represent the mean standard error. n = 5.

