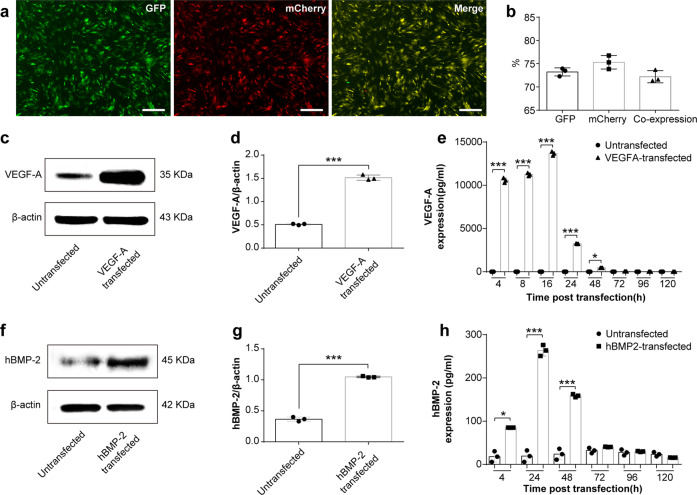
Fig. 1. Efficiency and protein kinetics of modRNA transfection in BMSCs.
a Representative fluorescence microscopy images of BMSCs taken 24 h after GFP and mCherry modRNA co-transfection. The scale bars represent 250 μm. b Flow data analysis depicted as a histogram revealing efficiency of co-transfections. (c–d, f, g) Comparison of VEGF-A (c–d) or BMP-2 (f, g) protein expression between naïve BMSCs and modRNA-transfected BMSCs at 24 h post transfection. e, h VEGF-A (e) or hBMP-2 (h) protein expression kinetics at indicated times following modRNA transfections. Data results are expressed as mean ± SD, n = 3, *p < 0.05, **p < 0.01, ***p < 0.001. (*p < 0.05) Indicate difference on secreted hBMP-2 or VEGF-A between untreated and transfected cells.

