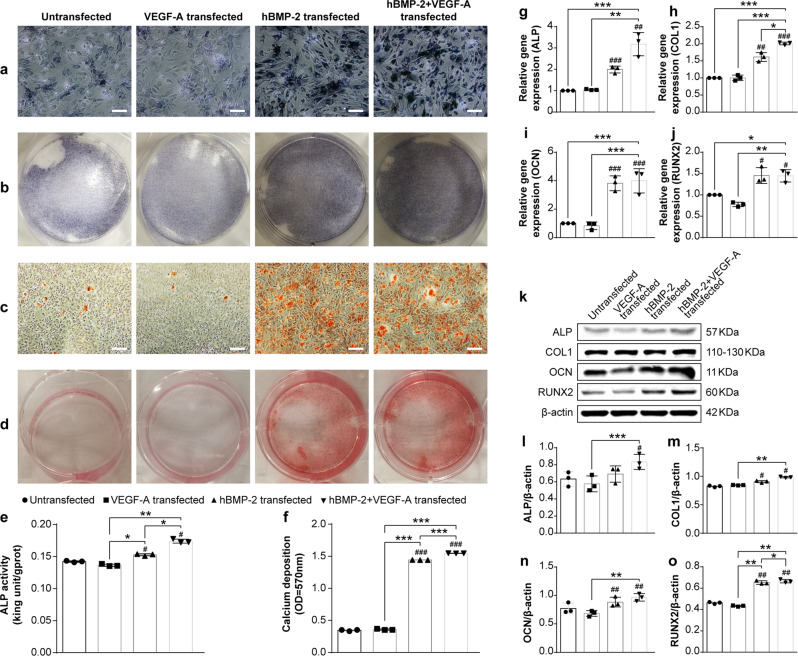
Fig. 2. Molecular and cellular detection of in vitro osteogenesis following modRNA transfection in BMSCs.
a Alkaline phosphatase (ALP) staining of BMSCs at 7 days post-transfection in different modRNA treatment groups. The scale bars represent 125 μm. b Gross appearance of ALP staining. c Detection of mineralized matrix using alizarin red staining 14 days post-transfection in indicated modRNA treatment groups. d Gross appearance of alizarin red staining 14 days post transfection. The scale bars represent 250 μm. e, f Quantification of ALP activity (e) 7 days post-transfection and quantification of alizarin red staining (f) 14 days post-transfection. Significant differences between untreated and modRNA-transfected cells are indicated by (*p < 0.05, **p < 0.01, ***p < 0.001). N = 6, one-way ANOVA test. g–j Fold increase in gene expression of (g) ALP, (h) Collagen Type I (COL 1), (i) Osteocalcin (OCN), and (j) Runt-related transcription factor 2 (RUNX2) at 7 days post-transfection determined by qRT-PCR analysis. k–o Representative western blot assessment (k) and quantification of protein expression of ALP (l), COL1 (m), OCN (n), and RUNX2 (o) following transfection of indicated modRNA treatments. Hash (#) indicate difference between non-transfection and transfection groups. Astersisk (*) indicate difference among different modRNA transfection groups. Results are normalized to the housekeeping gene (rat β-actin) and to the untreated cells. Values are shown as mean ± SD, #/*p < 0.05, ##/**p < 0.01, ###/***p < 0.001. N = 6, One-way ANOVA followed by Tukey’s multiple comparison.

