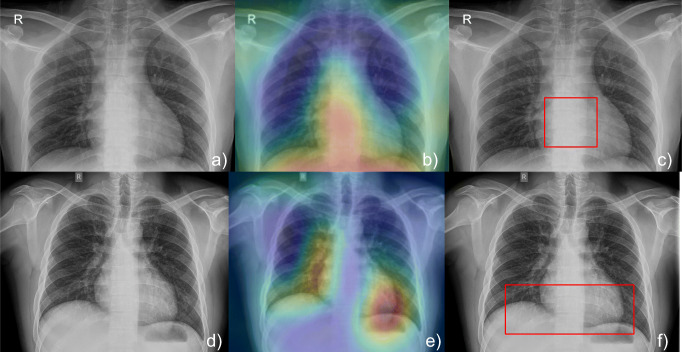
Fig. 4.
Top row shows a chest X-ray (a) from a COVID-positive patient adjudged as being normal by a radiologist. The CNN classified this as being COVID-positive. The RISE visualisation (b) shows network attention in the cardiac region; the local crop (c) is also focussed on the region of the heart just below the carina. The bottom row shows a radiograph of a COVID-negative patient adjudged as normal (d) by the radiologist and correctly classified as COVID-negative by the network. In this case, the visualisation shows attention at patchy distributed locations. Both predictions were made with 100% confidence. This pattern of visualisation was consistent in most radiographs in the test set

