Figure 1.

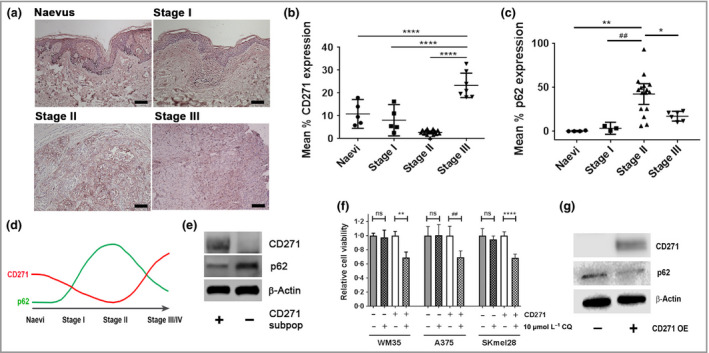
Expression and correlation of CD271 and the autophagy marker p62 in primary melanomas and metastatic melanoma cell lines. (a) Representative photomicrographs of immunohistochemical CD271 staining (pink) in a human benign naevus and American Joint Committee on Cancer (AJCC) stage I–III primary melanomas of increasing Breslow depth and spread (scale bars = 100 μm). Semi‐quantitative scoring of (b) CD271 and (c) p62 expression in naevi (n = 5) and AJCC stage I (n = 5), stage II (n = 15) and stage III (n = 7) primary melanomas. Each point is the mean CD271 or p62 expression of 10 images taken of each naevus or primary melanoma ± 95% confidence interval [CI; one‐way anova with Tukey's post‐hoc correction (*P = 0·027, **P = 0·001, ## P = 0·007, ****P < 0·001)]. (d) Schematic of observed pattern of CD271 expression (red line) during melanoma progression vs. previously reported biphasic expression of p62 (green line). (e) Representative Western blot analysis of CD271 (75 KDa), p62 (65 KDa) and β‐actin (42 KDa) expression in subpopulations of the WM35 metastatic melanoma cell line isolated using CD271 antibody‐tagged microbeads and magnetic separation columns. (f) Relative viability, as measured by 3‐(4,5,dimethythiazol‐2‐y)‐5‐(3‐carboxymethoxy‐phenyl)‐2‐(4‐sulfophenyl)‐2H‐tetrazolium, inner salt (MTS) metabolism, of isolated CD271+ and CD271– subpopulations from WM35, A375 and SKmel28 melanoma cell lines following 24‐h treatment in the presence or absence of 10 μmol L−1 chloroquine (CQ) [n = 18 replicates from three independent experiments; mean ± 95% CI, one‐way anova with Tukey's post‐hoc correction (**P = 0·003, ## P = 0·001, ****P < 0·001)]. ns, nonsignficant. (g) Representative Western blot analysis of CD271 (75 KDa), p62 (65 KDa) and β‐actin (42 KDa) expression in WM35 cells before and after lentiviral‐mediated overexpression of CD271 (CD271 OE).
